Last week, Sunday blogging was shifted to Monday because of a holiday, this time because of disease. I spent yesterday driving from Woods Hole to Amherst and sleeping on the couch. Not at the same time, smile. Feeling better today but still using up a hundredweight of tissues.
The past week in the lab, the calibration problem got solved. We started out by looking at the same cell, exciting fluorescence first with 544 nm light and then with 546 nm light. The 2 nm difference in wavelength is not enough to change the apparent dipole moment but each filter has its own independent calibration file. Surprisingly, both of these wavelengths gave polarized fluorescence with the same dubious orientation vectors. Hmm. The next day the boss, Rudolf Oldenbourg, got back from his holiday, and we showed him the images. He zeroed right in on a crucial setting in the software – namely is there a mirror in the light path, yes or no? We had been answering yes because there is a mirror in the light path. Fair enough. But it seems that the calibration already accounts for this mirror and by answering yes we were, in effect, adding a second mirror. Two rights made a wrong. Instead, when we answered no, hey presto! the orientations looked reasonable. Props to boss for understanding the system!
When we started this work two weeks ago, Mai put the cells into the kind of observation chambers she uses customarily, which are made from ordinary microscope slides and plastic spacers. This produces a volume for observation that is deeper than the cells. As a result many of the cells were end-on or oblique to the observing axis. I tried putting cells on a slide, without any spacer (just a drop of liquid and a coverslip). This seemed better –the cells were more generally perpendicular to the observing axis and the distance from the top of the cell to the bottom, read off the focus motor, was about the diameter of the cell, meaning the cells were not being flattened.
One of the dyes I have been using is fast scarlet (described a little at the end of the June 10thpost). In the literature, this is used at 0.01% (which is 10 mg/100 mL or 0.1 mg/mL). Because extra dye could be binding non-specifically, I wanted to try a lower concentration. I compared 0.1 mg/mL to ten times less and could see no difference between them. I do need to look at the values for anisotropy to see if the lower concentration gave rise to a stronger anisotropy (indicating less non-specific binding). But there was no difference in terms of the strength of overall fluorescence. It would probably be good to try another ten-fold decrease. No reason to use any more dye than needed. While I had nicely stained cells, I collected examples of several xylem cells for future study.
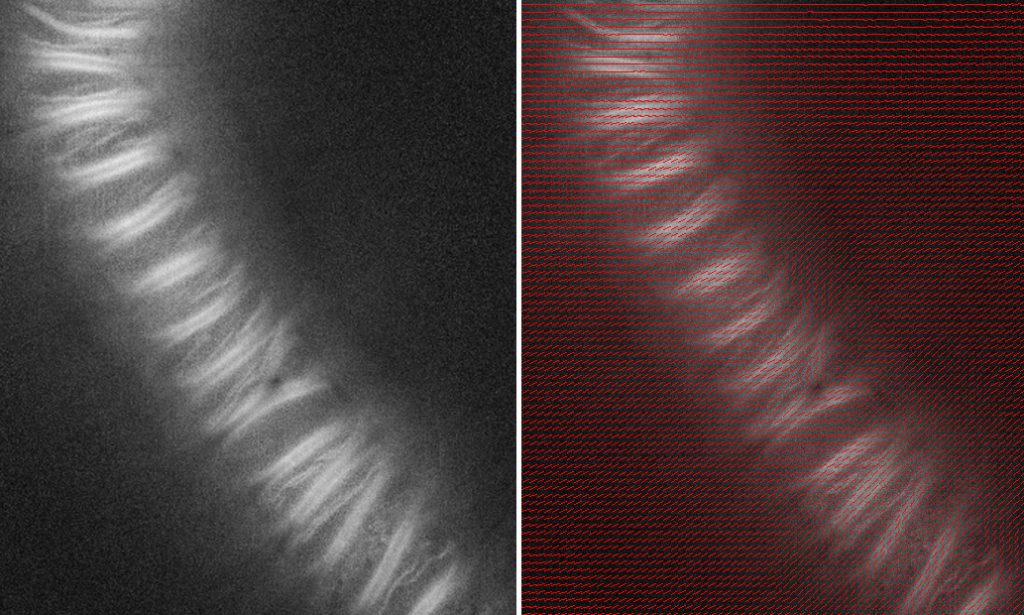
An example is shown in the figure. The image shows a BY-2 cell induced to differentiate into a tracheary element (a xylem cell). The prominent bands in the image are thickenings of the cell wall, formed to help this water pipe withstand the tension needed for water to flow from root to shoot, and rich in cellulose microfibrils.

The left-hand image shows the magnitude of polarized fluorescence. That is, the whiter the pixel, the more the fluorescence depends on the state of polarization of the exciting light. The dye binding to the xylem bands clearly emits polarized fluorescence. This is expected. Because cellulose in the bands is so well ordered and because the fluorescent dye binds cellulose not any-old-way but with a specific geometry, the bound dye molecules are themselves pretty well ordered. The ability of a molecule to absorb a photon depends on the relation between the geometry of the molecule and the polarization state of the photon. When dye molecules are lined up, this effect can be detected by virtue of polarized fluorescence (if the dye molecules are random then any direction of polarized excitation is as good as any other).
The right-hand image adds the direction of greatest absorption in the form of short red lines. The orientation of the red lines is parallel to the bands, whichever way the bands wander. Again, this is as expected and is indicating that our system (with the correct calibration setting) is working as it should be.
Previously, while Mai and were puzzling about calibration, we thought looking at cellulose crystals would be informative. Actually, even with the calibration thing solved this would be helpful for working out the way the dye binds to cellulose. I brought back some “Avicel cellulose” a commercial product advertised as being pure cellulose crystals. Indeed they probably are pure from a biochemical standpoint. But when we looked at them, we saw massive aggregations with crystal domains (as judged from birefringent retardation) running in every direction. I tried sonicating them but this did not make the aggregates any smaller.
I also brought back residue from Eri’s cellulose prep. This too should be biochemically pure cellulose. However, she air-dries the material thoroughly prior to weighing, but air drying drove all the fibers into a mat. A lovely object (cellulose paper) but useless for looking at individual fibers. I have asked Eri to run a prep without any air drying. This will keep the fibers more dispersed. Still, there are likely to be bundles but if they splay out and have a few loose ends, that will be perfect. Time will tell.