The Multiple Display module can be accessed by clicking the Topspin icon that shows two spectra on top of each other. This module has two very useful functions: 1. compare a number of different 1D spectra; and 2. view each 1D slice of a 2D or pseudo-2D spectrum.
When you are done with the Multiple Display module, you should click the Return button on the far right end of the Multiple Display submenu to go back to the main menu.
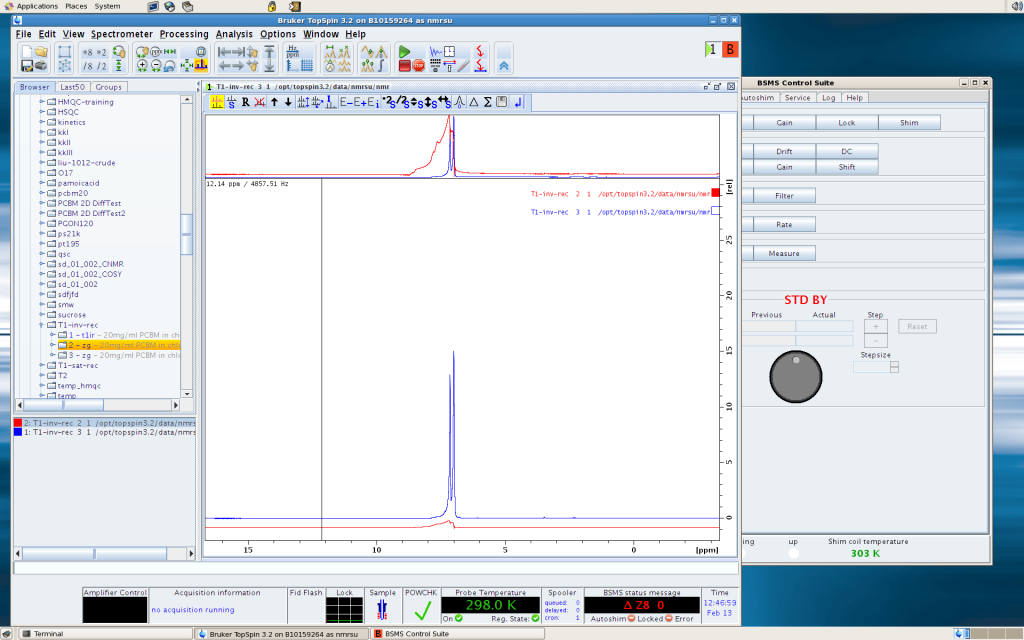
To compare two 1D spectra, let’s say spectrum A and B, (1) load A onto the display; (2) click Multiple Display button; (3) find B in the browser, and drag it into the Multiple Display window. See the picture below. You can highlight one of the spectrum in the lower left window (the one below the Browser), then use the buttons to move or rescale it.
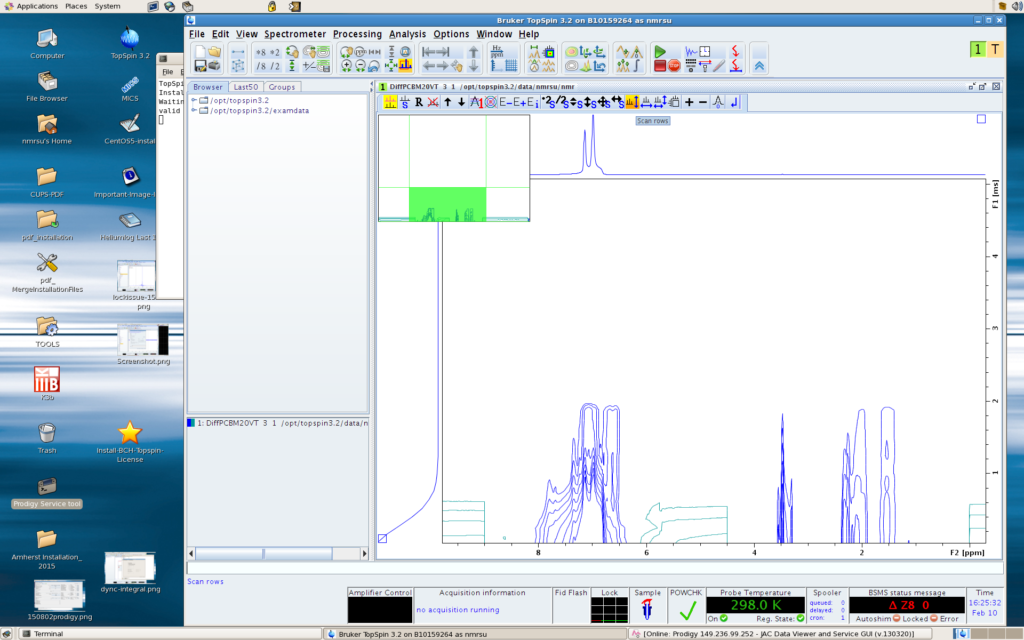
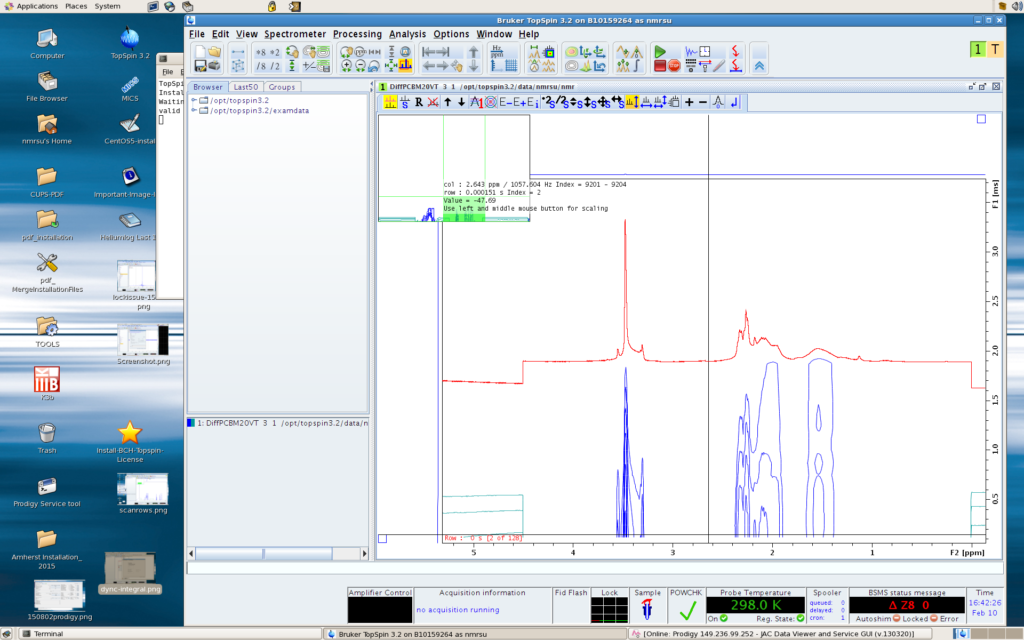
To view each slice of a 2D or pseudo-2D spectrum, first go into Multiple Display mode, then click the Scan Rows button (the highlighted button in the figure below). Then hover the mouse above the contour lines and you will see the slice. The first slice is at the very bottom while the last slice is at the top. You can use left click to make the peaks bigger, or click the mouse wheel to make them smaller. Making the peaks taller will help you better see if phase correction and/or baseline correction is needed.
The picture below shows one slice (slice #2, as the info box on the upper left corner shows “Index = 2”) of a pseudo-2D file.


