We often encounter decay behaviors that cannot be accurately described by a single exponential curve, e.g. in T1 relaxation curves and in diffusion NMR data. In such cases, multi-component fitting of the curves could be attempted.
See the following diffusion NMR data:
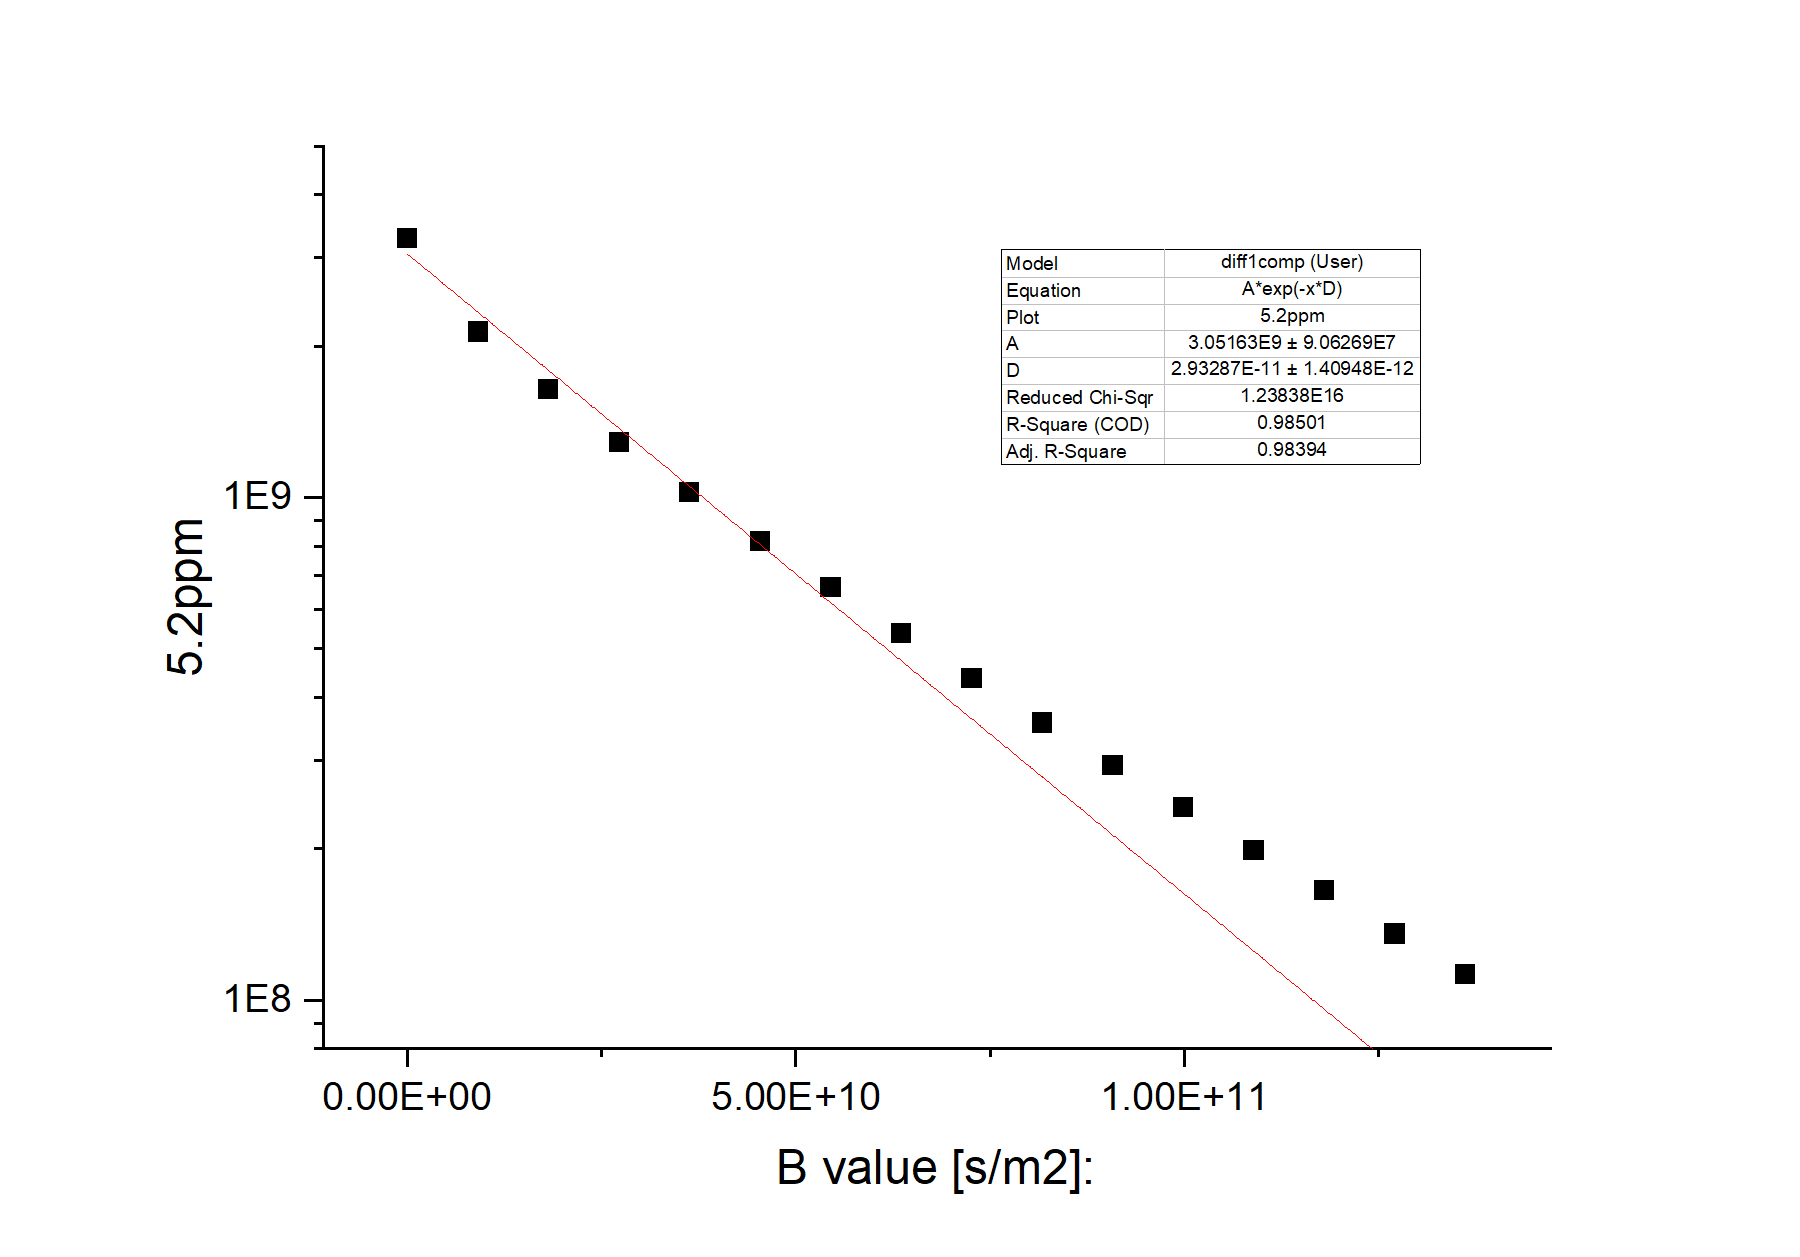
There is clearly a systematic deviation between the experiment data (black dots) and the single-exponential fit (red straight line). The resulting diffusion coefficient (D) has a relative error bar of ca. 5%. Upon close visual examination, we can notice that the experimental data decays faster in the beginning and decays slower toward the end. So a two-component fit might produce better results.
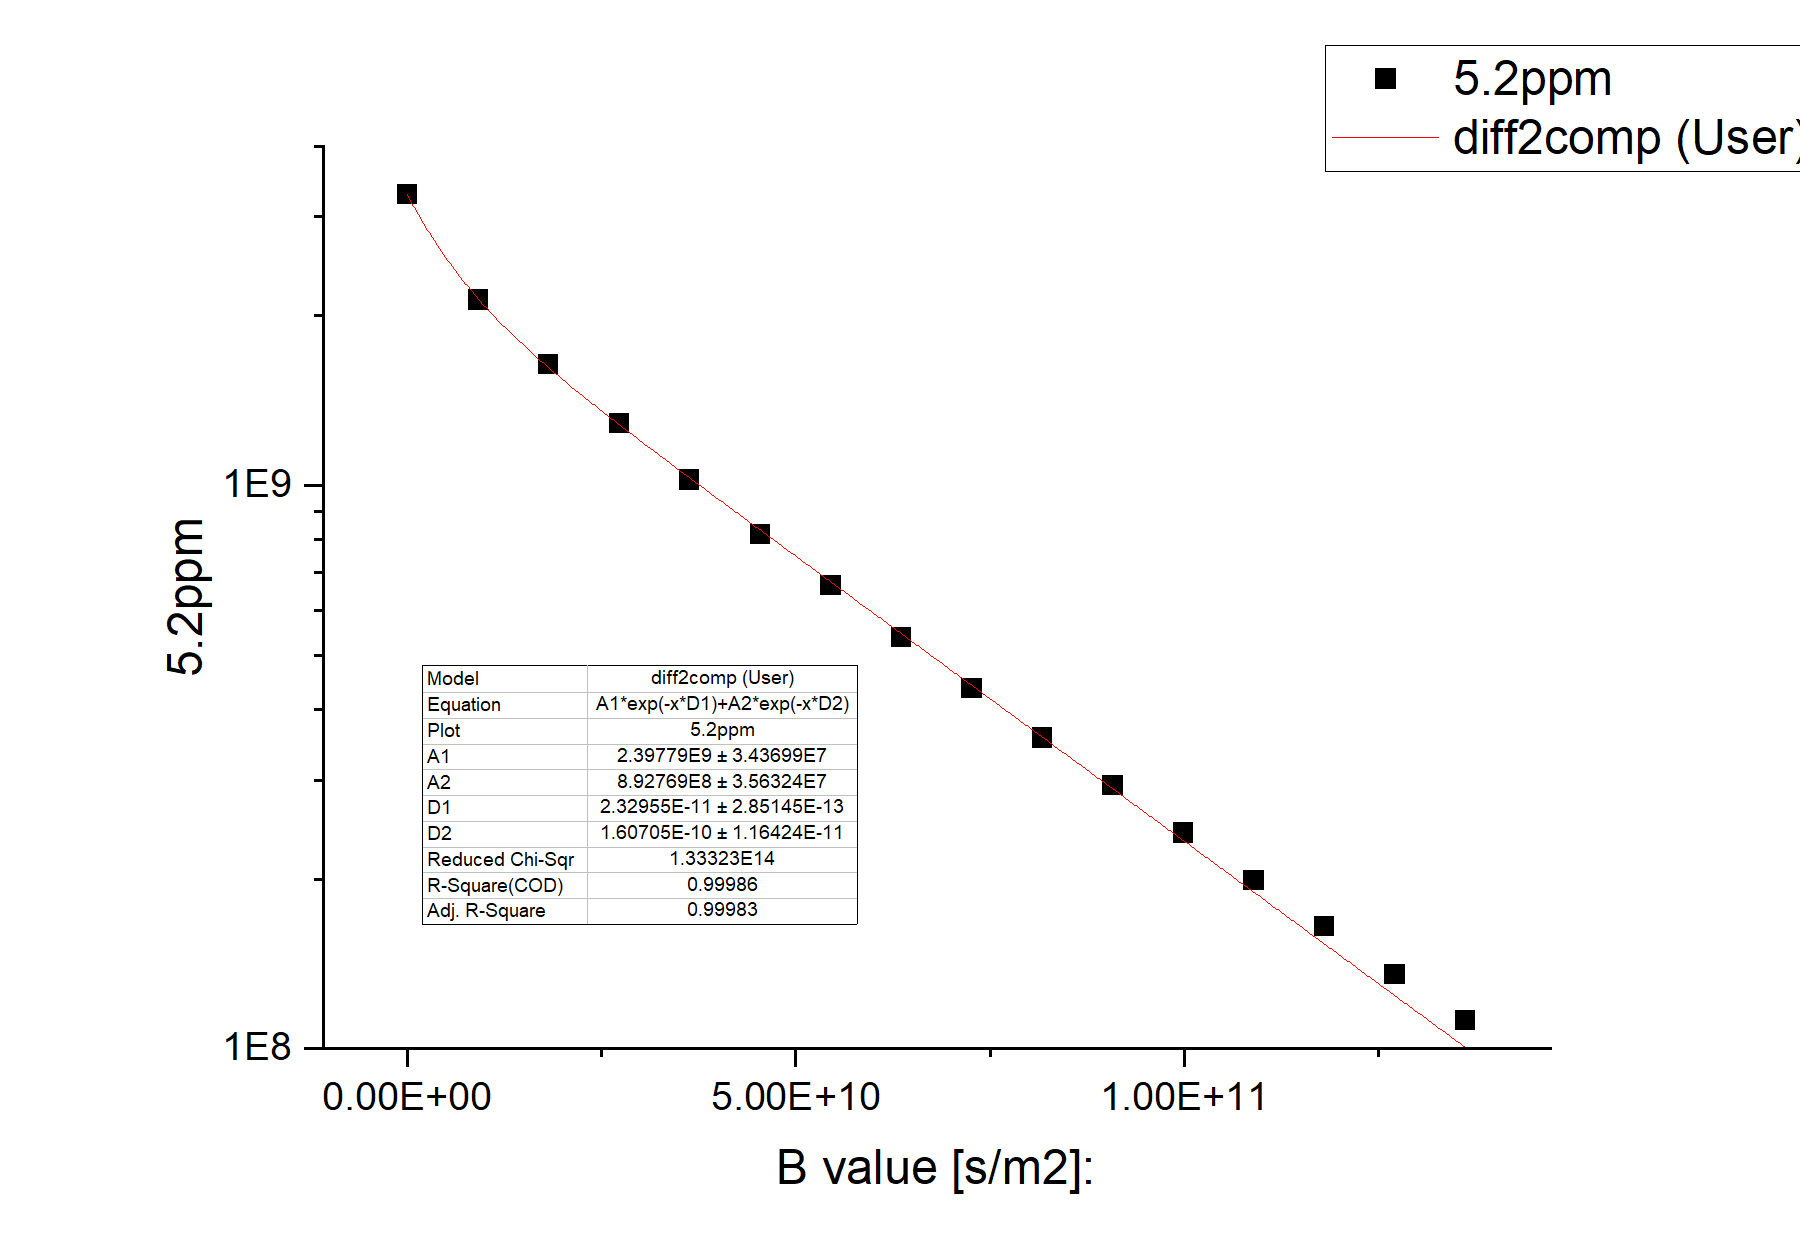
The equation of the two-component fit function can be seen in the inset of the figure above. The fitting quality is clearly much better. The reduced chi-square is two orders of magnitude smaller. A1 and A2 are the amplitudes of the two components, while D1 and D2 are their diffusion coefficients. Comparison of the two figures shows that a two-component system is a much better representation of the sample.