I am no longer updating this page. I now maintain a page with weekly totals for all cities and towns in Hampshire County, with per capita rates classified according to CDC guidelines.
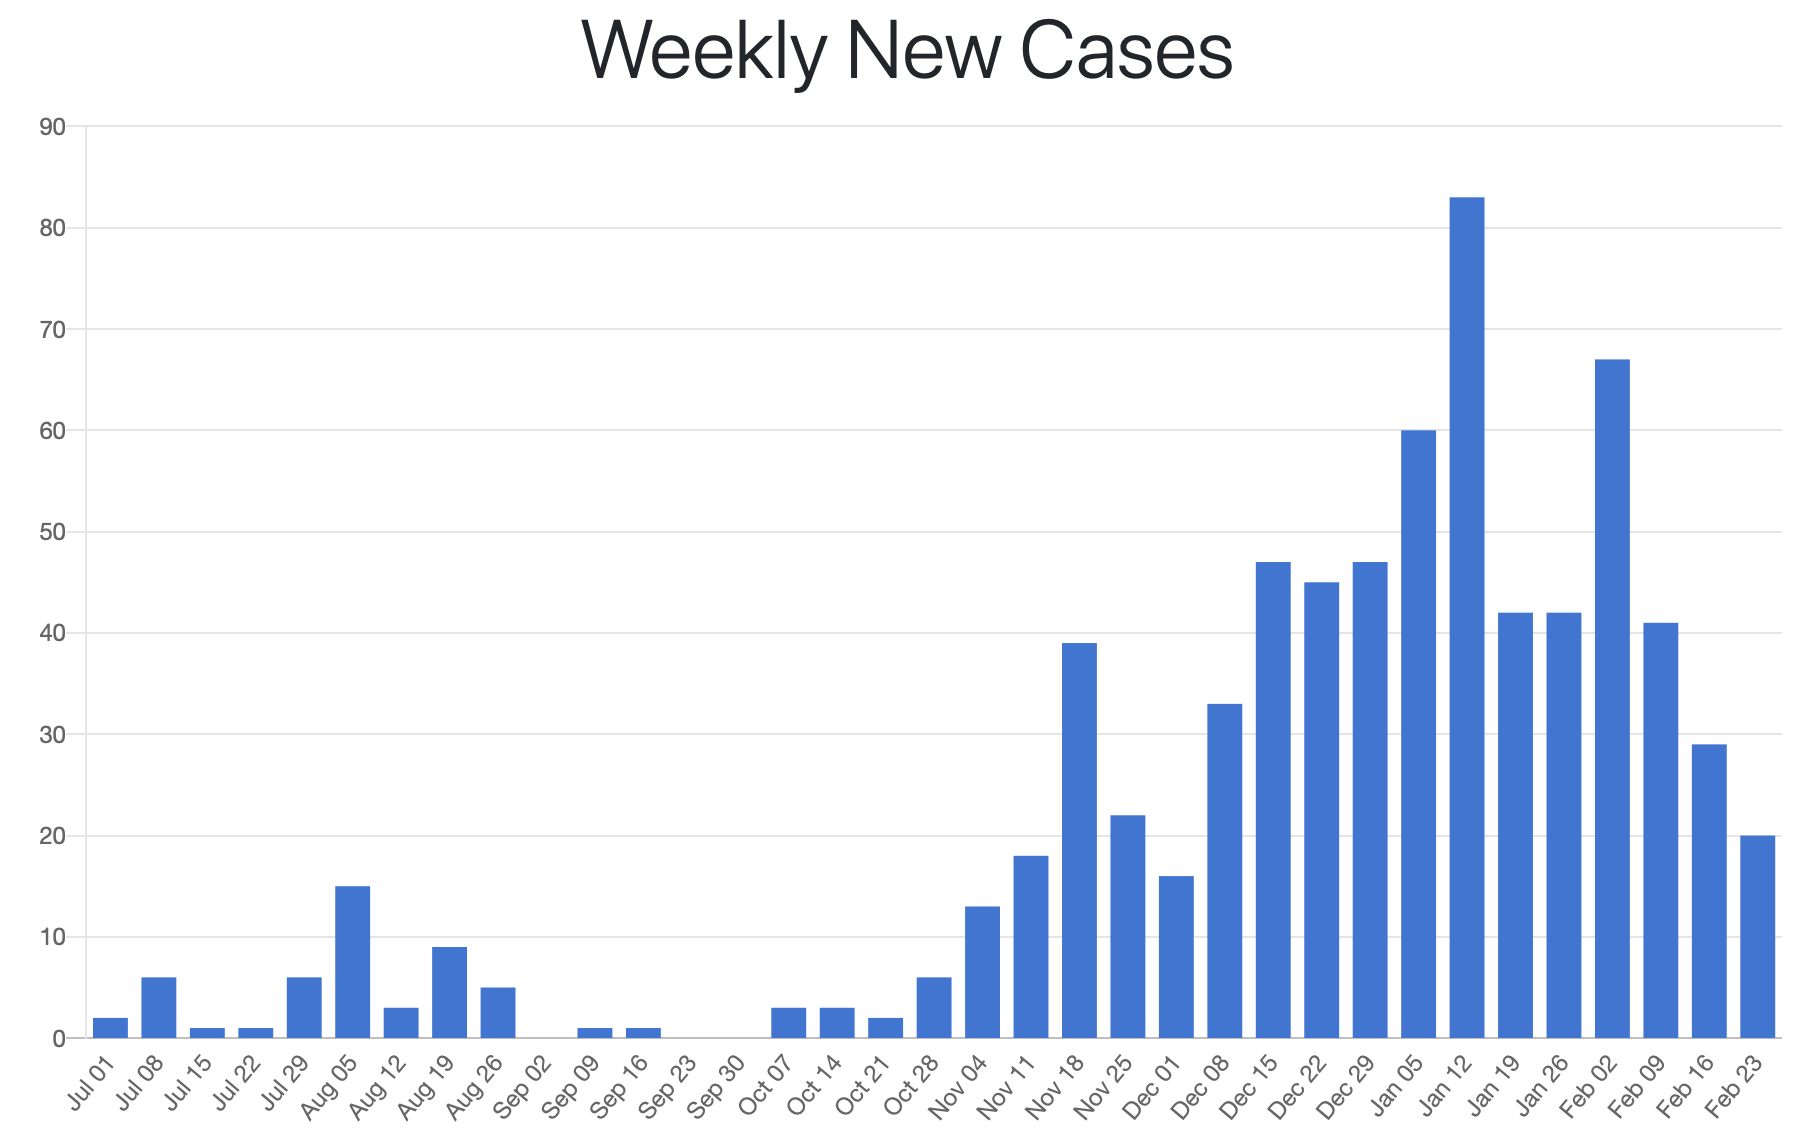
From https://matowncovid.org/northampton/ (other municipalities also available at that link). Weekly new cases based on the MassDPH public health reports: “These chart values are derived from Northampton’s changes in “Total Case Count” from the prior week. It’s not an exact science, due to reporting delays and occasional corrections.” (This week’s 20 comes from 1000 – 980). The seven day periods end on the dates shown on the horizontal axis. Given Northampton’s estimated population of 29199, the average daily rate per 100K is just under half the weekly total (100000 / 29199 / 7 = 0.49).
Northampton cumulative case numbers from https://northamptonma.gov/DocumentCenter/View/15974/Northamptoncases. This graph provides information on whether cases are in long-term health care facilities or in the broader community. “Residential clusters” refers to cases in long-term health care facilities, as can be inferred from Health Director O’Leary’s comments to the Dec. 3rd City Council meeting reported in the Hampshire Gazette on Dec. 7th. The graph on this page updates automatically with the city update.
The MassDPH weekly health report also provides counts on the numbers of tests performed, positive results, and a resulting positivity percentage. The Northampton data appear to be heavily skewed by results from asymptomatic testing at Smith College and other local higher ed institutions. I have written a paper on this issue with Mike Stein and Susan Voss.
Other resources
Cooley Dickinson provides updated counts of the number of COVID-19 hospitalizations here.
The New York Times provides up-to-date interactive new case graphs for counties here.