Shifting Subsidies From Corn Ethanol to Solar

Evan Chakrin: Horticulture

Ryan White: Animal science

Tim Miragliuolo: Building and Construction Tech.


A sun tracking solar panel in a corn field. (http://www.shutterstock.com)


Nobody likes wasteful government spending on programs that don’t benefit consumers or the environment, but that is exactly what’s happened with decades of corn ethanol subsidies. The American taxpayer is forced to underwrite the production of an inefficient energy source, and forced again to buy its product when used in gasoline mixtures at fuel stations across the country. Gasoline-ethanol mixes cost consumers miles per gallon and clog the fuel systems of seasonal use equipment and recreational vehicles (Regalbuto, 2009; Patzek et al., 2005) and do little to help the environment (Vedenov & Wetzstein, 2008). After having cost US taxpayers over 40 billion dollars from 1978-2012 (Melchior, 2016), federal tax code supports over 26 billion in subsidies for corn ethanol through 2024 (“Federal subsidies”, 2015). It is time to shift federal incentives toward truly renewable energy systems, and solar photovoltaic [PV] technology provides an excellent answer to our future energy needs. Due to the relative land usage, flexibility of installation, and greenhouse gas emission efficiency of PV systems, we believe that all future corn ethanol tax incentives should be redirected toward the installation of photovoltaic solar panel systems either in isolated systems or through collocation with viable biofuels and vegetable crops. Continue Reading

Hydraulic fracturing: A hope for climate change reduction or a curse?


Since the industrial revolution, a substantial percentage of our society relies on energy sources to carry out daily activities. Though energy can now come from renewable sources (e.g., wind, hydro, solar, etc.), the most common way of obtaining energy is through the burning of fossil fuels (e.g., gasoline, coal, oil, and natural gas) in combustion reactions resulting in the production of carbon dioxide, a powerful heat-trapping greenhouse gas (Ophardt, 2000). Greenhouse gases are needed to keep Earth’s atmosphere’s temperature balanced, but if excess gases accumulate in the atmosphere then it increases the temperature of Earth. Since the industrial revolution, increase in human activities have led to exceedingly large carbon dioxide emissions which is now accumulating in our atmosphere warming the planet rapidly. Models have shown that if steps towards climate change are not taken, the Earth could warm up to 2 degrees Celsius which will negatively affect Earth life to a great extent (IPCC, 2013).

While there are different options to obtain energy sources, some of them have harmful effects to our environment. One of the most popular ways to obtain energy is through the burning of coal. Coal based energy production accounts for more than 48% of domestic energy generation in the United States (Bligen, 2014 p. 893). The coal industry in the United States produced 782.4 million tons of coal in 2016 (EIA, 2017, page vii). From mining, to transportation to electricity generation, coal releases a lot of toxic pollutants into the air, water and land. The detrimental effects of coal use range from water pollution to health risks but the broader problem scientists observe is the impact to climate change due to the substantial carbon dioxide emissions. Coal-fired power plants are responsible for one-third of America’s carbon dioxide emissions-about the same as all transportation sources–cars, SUVs, trucks, buses, planes, ships and trains–combined (EPA, 2017, page ES-11). Coal is an important source of energy but it adds a significant amount of carbon dioxide per unit of heat energy more than the combustion of any other fossil fuel. In fact, coal combustion emits more than twice the climate changing carbon dioxide per unit of energy than natural gas production (EIA, 2017, Table #1).

At one point in their lifetime, the average American has used oil as an energy source, indirectly or directly. In addition to coal, the burning of oil has a large impact on our environment. About 40% of the energy consumed in the United States is supplied by petroleum (Bligen, 2010, p. 893). Since the amount of petroleum used varies depending on economics, politics and technology, estimates of carbon dioxide emissions are difficult to predict with certainty. Nevertheless, data has shown that the amount of carbon dioxide released from burning gasoline and diesel fuel was equal to 30% of total U.S. energy-related carbon dioxide emissions (EIA, 2017). In addition to CO2, oil powered plants can also emit particulates NOx and SO2 which are strong gases with direct impact to public health. The economic impact of emissions from oil combustion to public health, including illnesses, premature mortality, workdays lost and direct costs to the healthcare system is equal to 13 cents per kWh (Machol & Rizk, 2013, p. 76).  

Since energy is essential for modern economic and social development, it is crucial that the energy sector look for processes that reduce the negative impacts to our climate. Due to the increased concern over carbon dioxide emissions, natural gas production has increased over the past decade. Natural gas, a combustible gaseous mixture of methane and other hydrocarbons, is used extensively in residential energy; more than half of American use gas for home heating. Natural gas is seen as more climatically beneficial and energy efficient than coal or oil because its combustion produces more energy per carbon dioxide molecule formed than coal (170%) and oil (140%) (Karion et al., 2013, p. 4393).

Conventional natural gas extraction involves retrieving gas from large pools by using natural pressure from wells to pump the gas to the surface (British Columbia). However, conventional gas reservoirs have been depleting, therefore the industry relies on unconventional methods to extract gas from shale rock formations.  Unlike conventional gas, shale gas remains trapped the original rock that formed from the sedimentary deposition of mud, silt, clay, and organic matter on the floors of shallow seas (UCS). Methods of extracting said gas include horizontal drilling and hydraulic fracturing. Hydraulic fracturing, commonly known as fracking, is a process which is used to create cracks in shale rocks to allow air flow.

The rise of shale gas development can be traced back to the 1840s but the first experiment labeled as hydraulic fracturing occurred by late 1940s. By the 1960s companies such as Pan American Petroleum commercialized these techniques. In 1975, former president Gerald Ford promoted the development of shale oil resources as part of the overall energy plan to reduce foreign energy imports (Manfreda, 2015). The increase cost and climatic disadvantages that the oil and coal industry pose led to the sudden boom in the hydraulic fracturing industry. In 2000 shale gas represented 2% of United States natural gas production. By the end of 2016, it topped 60% (Brown, 2014, page 121; EIA, 2017)

Moreover, hydraulic fracturing also poses advantages to the economy in the United States. On average, the cost of gas extracted using hydraulic fracturing is two to three American dollars per thousand cubic feet of gas. This is 50-66 percent cheaper than production from other energy industries (Sovacool, 2014, page 253). Since conventional gas extractions have become more difficult because of depleting sources, natural gas prices could be 2.5 times higher in 30 years if unconventional gas extractions didn’t exist (Jacoby et al., 2012, p. 46). In addition, shale gas development has been proven to increase employment, revenue and taxes in production areas. Production on the Marcellus Shale brought 4.8 billion US dollars in gross regional product, created 57,000 jobs, and generated $1.7 billion in local, state and federal tax collections (Sovacool, 2014, p. 254). These benefits have prompted the United States to promote hydraulic fracturing as the new standard in the energy industry.

The process of hydraulic fracturing is presented to give a better understanding of how hydraulic fracturing works. The first step in hydraulic fracturing is finding a location with a shale rock formation that will produce natural gas. A shale rock formation is made up of fine grade sedimentary rocks that are are compressed into a clay, the shale that is used in fracking is black shale that is rich in organic matter. The  organic matter will undergo heat and pressure and some of it will transform into natural gas. Once the location is found the drilling begins. The drilling is broken into two parts the vertical drilling and the horizontal drilling. The workers first have to drill vertically to a depth around 1,000 feet underground when this is finished a steel casing is inserted into the well so the risk of pollutants won’t spread through the earth’s bedrock and won’t affect groundwater. After the vertical drilling is complete, the horizontal drilling extends out to about 1.5 kilometers through the shale rock formation. After the drilling of the well is completed a specialize performing gunshot is shot which in return creates small holes in the shale formation completing the drilling part of the well (Nacamulli, 2017).

Contrary to popular belief, hydraulic fracturing is not the process of drilling but rather a method used to extract gas after a hole is completed. It is a process that involves injecting water, sand and chemicals at a high pressure into a tight rock formation via a well to stimulate and boost gas flow (Schneising et al., 2014). The propellant in the liquid then goes into the small fractures which keeps them open and allows either the gas or oil to escape from the earth and go up the well and be collected (Schneising et al., 2014). After a well is drilled liquids, such as water and acid, and sand are pumped down the well at high pressures to crack rocks and stimulate shale gas flow. After the shale rock is cracked, the liquid is pumped back to the surface to retrieve the natural gas, this process is known as flowback (Allen et al. 2013). After natural gas is retrieved, the fracking liquid is either pumped back into a separate well and then the well is closed; transported to a water treatment facility or re-used for the stimulation of another well. Recycling the same chemicals with fluid used in new operations contaminates the fluid and creates a more harmful emission the next time around (Nacamulli, 2017). The last step of hydraulic fracturing is the abandonment and plugging of the well. This is done by plugging the well with cement.  

While natural gas does decrease carbon dioxide when used as fuel, there is a concern that the process of fracking leads to massive methane escapes, which is concerning since methane is a potent greenhouse gas (GHG). GHGs are gases that trap heat in the atmosphere. GHGs from human activities are the most significant driver of observed climate change since the mid-20th century (IPCC, 2013). The problem lies in the concentration of greenhouse gases in our atmosphere; if too much is in our atmosphere, then more heat is trapped which leads to the planet warming at an unbalanced state. Models have shown that if society doesn’t take the necessary precautions to reduce greenhouse gas emissions, the Earth could warm up by 2 degrees Celsius which substantially impact Earth life as we know it (IPCC, 2013).

As mentioned before, methane is potent strong greenhouse gas with severe environmental impacts; it has a global warming potential (GWP) of 34 (IPCC, 2013). GWP for a gas is a measure of the total energy a gas absorbs over a particular time period compared to carbon dioxide. The larger the GWP, the more warming the gas causes. Methane has a GWP of 34 meaning that it will cause more warming than carbon dioxide. Methane, however, has a shorter life-time in the atmosphere compared to carbon dioxide. Atmospheric lifetime refers to the amount of time a gas stays in the atmosphere before it is released into space. Methane stays in the atmosphere for a decade, carbon dioxide however is more difficult to measure because there is a myriad of biological processes that remove carbon dioxide from the atmosphere therefore carbon dioxide can actually stay in the atmosphere for thousands of years. Carbon dioxide is the focus on climate change reform because of its long atmospheric lifetime but some scientists claim that there is no way to reduce carbon dioxide emissions in time. Even with major carbon dioxide reductions, Howarth argues that the planet could reach 1.5 degrees in 12 years and 2 degrees in 35 years (as cited in Maggill, 2016). Since the planet responds much more rapidly to methane, a reduction in methane emissions could potentially slow global warming. In order for hydraulic fracturing to provide a net climatic benefit, methane emissions must be lower than 3.2% (Alvarez, Pacala, Winebrake, Chameides, and Hamburg, 2012, page 6437.  However, studies have shown that methane emissions from operating shale gas formations emit higher percentages of methane than 3.2% (Alvarez et al., 2012; Caulton et al., 2014 ; Karion et al., 2013; Schneising et al., 2014). Methane emissions will continue to increase as fracking grows in popularity therefore reform in technologies need to be made in order to create cost and climatic benefits in energy production.

While fugitive methane leakages at fracturing sites are a recognized concern for climate change, methane emissions and leakage are challenges because they occur at various locations during gas extraction and processing. During flowback, we experience the largest amount of  methane emissions are exhibited. As the fracking liquid comes back to the surface, it brings methane released from the shale. During the flowback period, as much as 3.2% of the total natural gas extracted is emitted into the atmosphere (Howarth, Santoro & Ingraffea, 2011 , p. 681). The methane is either captured by emission control devices or emitted into the atmosphere (Allen et al. 2013). Research has shown that methane emissions from shale gas development might be a result of drilling through coal beds which are known to release large amounts of methane. Popular fracking sites, such as the Marcellus Shale formation, are located over coal beds. Another way methane can leak into the atmosphere is through the transportation of natural gas. As natural gas is transported from the well to the storage containers methane leaks through equipment, typically wells have 55 to 150 connections to equipment and make up nearly 90% of methane emission from heaters, meters dehydrators, compressors and vapor-recovery apparatus. (Howarth et al., 2011, Pg. 683) Researchers observed this by examining the unaccounted gas, which is measured by comparing the volume of gas at the wellhead and the amount of gas that was purchased. The estimate of leakage during this time is estimated at 2.5% of emissions (Howarth et al., 2011 Pg. 684-685). Even though it is difficult to trace methane leakage from hydraulic fracturing to just one stage, all of these leaks could be reduced by improving the equipment used. Research performed has shown that the cement used to prevent leaks from well equipments into the atmosphere fails due to installation and material problems (Ingraffea, Wells, Santoro, & Shonkoff, 2014). Since methane emissions from hydraulic fracturing need to be lower than 3.2%, it is crucial that the industry implement reforms to innovate fracking equipment.

Fortunately, methane leaks from fracking are not impossible to stop, and some states have already implemented stricter regulations in order to minimize them. In 2014 Colorado became the first state in the country to place limits on methane emissions from oil and gas operations (Ogburn et al., 2014). Most methane that is lost from fracking comes from leaks in the well infrastructure as well as leaks in the transportation process. In an effort to reduce methane emissions from fracking, Colorado adopted rules which required operators detect and fix leaks and install devices to capture 95 percent of methane emissions (Marmaduke, 2016). It was believed that nearly every step of the methane harvesting process resulted in some amount of methane leakage. In 2016 the Environmental Protection Agency (EPA) passed a rule that was based off of the rule that Colorado had already passed two years earlier. The EPA estimates that theses rules will cut methane emissions by 510,000 tons by the year 2025, which is equal to the amount of greenhouse gases generated by 11 coal fired power plants (Marmaduke, 2016). In the state of Colorado alone, the chief of health estimated that the new rules could cut overall air pollution by 92,000 tons, which is the equivalent of taking every car in the state of Colorado off the road for an entire year (Kroh, 2013). Colorado made significant changes to their emissions standards by requiring all fracking companies to install maximum achievable control technology (MACT). MACT is a set of standards set by the EPA for over 100 categories of different sources of air pollution (West Virginia, 2014). This means that for each of the sources of the pollution the EPA has observed they have set a standard for that source that the company needs to meet. In most cases these standards involve having to install new equipment and machinery that allows less leaks (West Virginia, 2014). In order to install the MACT technology, oil and gas companies will need to be prepared to devote serious financial resources to making it happen. Implementing MACT would force companies to upgrade technology by installing pollution controls, including activated carbon injection, scrubbers or dry sorbent injection, and upgrade particulate controls (Bipartisan, 2013).

The cost of implementing MACT will be high but the costs of climate change are even higher. The cost to implement the technology to meet these standards would be roughly 10.9 billion dollars per year for energy companies that are forced to comply (Bipartisan, 2013). This money would be made up by increasing utility for all customers of companies affected. The EPA estimates that rule would result in an electricity price increase of 3.7 percent and natural gas prices would increase by an average of 0.6 to 1.3 percent (Bipartisan, 2013). This would mean the average natural gas customer would see their yearly bill increase by between $5.95 and $12.90 and the average yearly electrical bill would increase by $49.98 (EIA 2016; Shannon, 2016). By increasing the prices of their customers the companies would be left with a small fraction of the actual cost of the technology and would therefore not have to take on such a financial burden.

The information provided has given use concrete examples and facts about the amount of pollution that’s being emitted into the earth’s atmosphere from fracking. We need to understand   that we need to find a way to make natural gas the great clean energy source that is wanted by many people. Some methane emissions are essential to regulate because of their threat to climate change now and in the future, as we look more for the use of natural gas energy. By understanding the negative impacts of the extraction of natural gas is very important to know how we need to fix the problem of fracking to make fracking clean er and less pollutant. Overall we need to take some emissions present and reduce them to produce natural gas the green energy that is supposed to be. We have seen significant improvements in Colorado act to clean up the methane emissions from fracking.

AUTHORS

Andrea Vázquez – Animal Science

Noah Marchand – Environmental Science

Shawn MacDonald – Geology


REFERENCES

Allen, D. T., Torres, V. M., Thomas, J., Sullivan, D. W., Harrison, M., Hendler, A., . . . Seinfeld, J. H. (2013). Measurements of methane emissions at natural gas production sites in the United States. Proceedings of the National Academy of Sciences, 110(44),

17768-17773. doi:10.1073/pnas.1304880110

Alvarez, R. A., Pacala, S. W., Winebrake, J. J., Chameides, W. L., & Hamburg, S. P. (2012). Greater focus needed on methane leakage from natural gas infrastructure. Proceedings of the National Academy of  Sciences of the United States of America, 109(17),

6435–6440. http://doi.org/10.1073/pnas.1202407109

Bipartisan. (2013, February 06). Assessment of EPA’s Utility MACT Proposal. Retrieved from: https://bipartisanpolicy.org/library/assessment-epas-utility-mact-proposal/

Bilgen, S. (2014). Structure and environmental impact of global energy consumption. Renewable and Sustainable Energy Reviews, 38(Supplement C), 890-902. doi:10.1016/j.rser.2014.07.004 British Columbia. Conventional versus unconventional oil and gas. Retrieved from: https://www2.gov.bc.ca/gov/content/industry/natural-gas-oil/petroleum-geoscience/pet-geol-conv-uncon

Brown, J. (2014). Production of natural gas from shale in local economies: A resource blessing or curse? Economic Review, 1-29. Retrieved from https://EconPapers.repec.org/RePEc:fip:fedker:00005

Caulton, D. R., Shepson,P. B., Santoro, R. L., Sparks, J. P., Hogarth, R. W., Ingraffea, A. R., .. . Miller, B. R. (2014). Toward a better understanding and quantification of methane emissions from shale gas development. Proceedings of the National Academy of Sciences, 111(17), 6237-6242. doi:10.1073/pnas.1316546111

Energy Information Administration. [EIA]. (2016). 2016 Average Monthly Bill- Residential. [Data file]. Retrieved from:https://www.eia.gov/ electricity/sales_revenue_price/pdf/table5_a.pdf

Energy Information Administration. [EIA]. (2017). Annual Coal Report. Washington, DC: U.S. Energy Information Administration.

Energy Information Administration. [EIA]. (2017). Annual Energy Outlook 2017. Washington, DC: U.S.  Energy Information Administration.

Energy Information Administration.[EIA]. (2017). How much carbon dioxide is produced from burning gasoline and diesel fuel? Retrieved from      https://www.eia.gov/tools/faqs/faq.php?id=307&t=9

Energy Information Administration. [EIA]. (2017). How much carbon dioxide is produced when different fuels are burned. [Table]. Retrieved from      https://www.eia.gov/tools/faqs/faq.php?id=73&t=11

Environmental Protection Agency. [EPA]. (1994). Plugging and Abandoning Injection Wells United States Environmental Protection Agency Region 5 Guidance #4. Chicago, IL: Environmental Protection Agency.

Environmental Protection Agency. [EPA]. (2016). Sulfur Dioxide Basics. Retrieved from https://www.epa.gov/so2-pollution/sulfur-dioxide-basics#effects

Environmental Protection Agency. [EPA]. (2017). Inventory of U.S. Greenhouse Gas EmissionS and Sinks. (EPA Publication No. EPA 430-P-17-001). Washington, DC: U.S. Environmental Protection Agency

Howarth, R., Santoro, R., & Ingraffea, A. (2011). Methane and the greenhouse-gas footprint of natural gas from shale formations. Climatic Change, 106(4), 679-690. doi:10.1007/s10584-011-0061-5

Ingraffea, A.R., Wells, M.T., Santoro, R.L., & Shonkoff, S.B.C,. (2014). Assessment and risk analysis of casing and cement impairment in oil and gas wells in

Pennsylvania, 2000—2012. Proceedings of the National Academy of Sciences of the United States of America, 111(30), 10955-10960. doi:10.1073/pnas.1323422111 IPCC, 2013: Climate Change 2013: The Physical Science Basis. Contribution of Working

Group I to the Fifth Assessment Report of the Intergovernmental Panel on Climate Change [Stocker, T.F., D. Qin, G.-K. Plattner, M. Tignor, S.K. Allen, J. Boschung, A. Nauels, Y. Xia, V. Bex and P.M. Midgley (eds.)]. Cambridge University Press, Cambridge, United Kingdom and New York, NY, USA, 1535 pp, doi:10.1017/CBO9781107415324.

IPCC, 2007: Summary for Policymakers. In: Climate Change 2007: The Physical Science

Basis. Contribution of Working Group I to the Fourth Assessment Report of the Intergovernmental Panel on Climate Change [Solomon, S., D. Qin, M. Manning, Z. Chen, M. Marquis, K.B. Averyt, M.Tignor and H.L. Miller (eds.)]. Cambridge University Press, Cambridge, United Kingdom and New York, NY, USA.

Jacoby, H.D., F. O’Sullivan and S. Paltsev (2012): The Influence of Shale Gas on

U.S. Energy and Environmental Policy. Economics of Energy & Environmental Policy, 1(1): 37-51

Karion, A., Sweeney, C., Pétron, G., Frost, G., Michael Hardesty, R., Kofler, J., . . . Conley, S.

(2013). Methane emissions estimate from airborne measurements over a western united states natural gas field. Geophysical Research Letters, 40(16), 4393-4397. doi:10.1002/grl.50811

Kissinger, A., Helmig, R., Ebigbo, A., Class, H., Lange, T., Sauter, M., . . . Jahnke, W. (2013). Hydraulic fracturing in unconventional gas reservoirs: Risks in the geological system, part 2. Environmental Earth Sciences, 70(8), 3855-3873. doi:10.1007/s12665-013-2578-6

Kroh, K. (2013, November 19). Colorado to crack down on methane emissions from fracking. Retrieved from:http://grist.org/climate-energy/colorado-to-crack-down-on-methane-

emissions-from-fracking/

Machol, B., & Rizk, S. (2013). Economic value of U.S. fossil fuel electricity health impacts. Environment International, 52(Supplement C), 75-80. doi:10.1016/j.envint.2012.03.003

Magill, B. (2014, July 1). Fracked Oil, Gas Well Defects Leading to Methane Leaks.

Retrieved from: http://www.climatecentral.org/news/shale-gas-well-defects-methane-leaks-17701

Manfreda, J. (2015, April 14). The origin of fracking actually dates back to the Civil War. Retrieved from: http://www.businessinsider.com/the-history-of-fracking-2015-4

Marmaduke, J. (2016, May 12). Colorado oil and gas unaffected by new EPA methane rules. Retrieved fromhttps://www.usatoday.com/story/news/2016/05/12/epas-methane-rule -mirrors-colorado-regulations/84284706/

Nacamulli, M. (2017, July 13). How does fracking work? [Video file]. Retrieved from https://www.youtube.com/watch?time_continue=100&v=Tudal_4x4F0  

Ogburn, C. S. (2014, February 25). Colorado First State to Limit Methane Pollution from Oil and Gas Wells. Scientific American. Retrieved from https://www.scientificamerican.com/article/colorado-first-state-to-limit-methane-pollution-from-oil-and-gas-wells/

Ophardt, C. E. (2013) Carbon Dioxide and Fossil Fuels  [PowerPoint Slides]. Retrieved from Virtual Chembook Web site: http://chemistry.elmhurst.edu/vchembook/globalwarmA4.html

Schneising, O., Burrows, J. P., Dickerson, R. R., Buchwitz, M., Reuter, M., . . . Bovensmann, H. (2014). Remote sensing of fugitive methane emissions from oil and gas production in North American tight geologic formations. Earth’s Future,

2(10), 548-558. doi:10.1002/2014EF000265

Shannon, C. (2016, August 20). Utility Bills 101: Tips, Average Costs, Fees, and More. [Blog post].  Retrieved from http://www.move.org/blog/utility-bills-101 Sovacool, B. K. (2014). Cornucopia or curse? reviewing the costs and benefits of shale gas hydraulic fracturing (fracking). Renewable and Sustainable Energy Reviews, 37(Supplement C), 249-264. doi:10.1016/j.rser.2014.04.068

Turner, A. J., Jacob, D. J., Benmergui, J., Wofsy, S. C., Maasakkers, J. D., Butz, A., . . . Biraud, S. C. (2016). A large increase in U.S. methane emissions over the past decade inferred from satellite data and surface observations.Geophysical Research Letters, 43(5), 2218-2224. doi:10.1002/2016GL067987

Union of Concerned Scientists. [UCS] Shale gas and other unconventional sources of natural gas. Retrieved from: http://www.ucsusa.org/clean-energy/coal-and-other-fossil-fuels/shale-gas-unconventional-sources-natural-gas#.WiYtShiZNE6

West Virginia Department of Environmental Protection. (2014) MACT NESHAP Standards. Retrieved from http://dep.wv.gov/daq/Air%20Toxics/Pages/MACTNESHAPStandards.aspx

Drilling in the ANWR and the Arctic Porcupine caribou problem

Alaska, Caribou, North Slope oil fields, Rangifer tarandus, Porcupine herd, moving past Prudhoe Bay Arctic Drilling Rig, North Slope, Alaska, 1978

The Arctic porcupine caribou has traversed the same migration path for the past 27,000 years. Surviving the last two major glaciations, the Arctic caribou once stood alongside Mastodons, Wooly Mammoths and Sabre-Tooth Tigers, but today they are being threatened (Maher, P., 2017). Chevron, British Petroleum, Arco and Exxon have begun to fight for the land the caribou have called home for decades. These companies want oil. Under the Arctic porcupine caribou, lies huge reserves of crude oil. Completely oblivious of the multi-billion dollar companies vying for the land beneath their hooves, the Arctic caribou teeters on the edge of disaster.

The Arctic National Wildlife Refuge (ANWR) established in 1960 by President Dwight D. Eisenhower, protects the Arctic’s “unique wildlife, wilderness, and recreational values” (US Fish and Wildlife Service, 2014). The ANWR expanses 19.64 million acres on the northern coastline of Alaska (National Park Service, n.d.). In 1980, this area’s future was solidified as President Jimmy Carter expanded the protection, designating much of it as “protected wilderness” under the Alaska National Interests Lands Conservation Act (ANILCA) (“A Brief History of the Arctic National Wildlife Refuge”, 2017). Protected wilderness, defined as the “wildest of the wild”, is “an area where the earth and its community of life are untrammeled by man, where man himself is a visitor who does not remain” (“Why Protect Wilderness”, n.d.). It contains no roads or other kinds of human development. It is the highest level of conservation protection offered by the federal government.

Within ANILCA, Section 1002 mandated a comprehensive assessment of natural resources on the 1.5 million acres of the refuge’s Coastal Plain. This assessment included research into fish, wildlife, petroleum, and the potential impacts of petroleum and gas drilling on the region. Because the ANWR Coastal Plain is discussed in Section 1002 of ANILCA, it is now referred to as the 1002 Area (U.S. Fish and Wildlife Service, [USFWS] 2014)

Much of what we know today about animal species in the ANWR comes from the ANILCA natural resource assessment. The ANWR is home to an array of 250 species of wildlife, including polar bears, Arctic caribou, grizzly bears, and various species of waterfowl (Alaska Wilderness League, 2017). The ANWR is the only national conservation area where polar bears regularly den and has become increasingly important as polar bear habitat is lost to climate change (Refuge Association, 2017). Birds from the ANWR migrate to every US state and territory, and can be found on 6 continents. The porcupine caribou herd, the largest caribou herd within the ANWR, returns every spring to the Coastal Plain to calve and raise their young (Refuge Association, 2017).

The ANWR porcupine caribou herd is one of the largest caribou herds in the world, with approximately 197,000 members (U.S. Fish and Wildlife Service, 2016). The ANWR is the only place on Earth that someone can find a porcupine caribou. The ANWR, home to a network of plains, waters and mountains, provides an environment unlike almost anywhere else. Its unique ecological composition makes it the perfect place for the porcupine caribou to live, raise their young and migrate throughout (“Frequently Asked Questions”, n.d.).

In the spring, the caribou leave their southern habitat and move north to the Coastal Plain of the ANWR. This is the preferred calving, or birthing, ground of the herd. Members of the herd travel anywhere from 400 to 3,000 miles to get to this area. After the caribou give birth in June, the herd remains on the Coastal Plain and forages until mid-July, allowing time for the calves to grow strong enough to journey south (Refuge Association, 2017).

The Coastal Plain is the preferred calving habitat of the porcupine herd for multiple reasons. The Plain has a small population of predators such as brown bears, wolves, and golden eagles. This gives calves a greater chance of survival in their youngest stages. The Coastal Plain also has an abundance of vegetation preferred by Arctic caribou. Vegetation thrives during the caribou calving period, providing pregnant and nursing caribou with the nutrition needed to survive the harsh conditions (Refuge Association, 2017). The ANWR Coastal Plain is the only place that the caribou could raise their young.

For thousands of years, the Gwich’in or “caribou people” of the ANWR have depended on the migrating arctic porcupine caribou for food, clothing, shelter and tools. The Gwich’in culture is so “interwoven with the life-cycle of the herd” that their survival as a people is completely dependent on the caribou (Albert, P., 1994). One fundamental Gwich’in belief is that “every caribou has a bit of the human heart in them; and every human has a bit of caribou heart.” Paul Josie, a member of one of the 13 Gwich’in villages, describes any “threat to the caribou is a threat to us… to our way of life” (Maher, P., 2017). Not only does the caribou satisfy these indigenous people’s spiritual needs, but the hunting and distribution of the caribou meat enhances their social interaction with other tribes in the area. The caribou has become a vital component of the indigenous people’s mixed subsistence-cash economy (Maher, P., 2017).

But the lives of both the porcupine caribou and the Gwich’in people are at risk. Oil development in the ANWR is threatening the migratory and birthing habits of the caribou, which in turn jeopardizes the Gwich’in way of life.

       If the ANWR was to be developed for oil production, it is estimated that 303,000 acres of calving habitat, or 37% of their entire natural calving habitat would be lost to human development (US Department of the Interior, p. 120). Furthermore, studies indicate there is a direct correlation between human development and a decrease in animal habitat quality of the ANWR. In areas within 4 km of surface development, caribou use of the land declined by 52% (Nelleman & Cameron, 1996, p. 26). There is an estimated 1,000 meter disturbance zone around oil wells and a 250 meter disturbance zone around roads and seismic lines (Dyer et al., 2001, p. 531). The most consistently observed behavior in response to these petroleum developments among calving caribou is avoidance of the petroleum infrastructure (Griffith et al., 2002, p. 34). Because the ANWR is currently undeveloped, drilling development would need to be widespread and has the potential to take up huge amounts of land. Roads, barracks, storage structures, well pads, and pipelines would all have to be created. The negative impacts on the caribou from human development would be amplified and enormous.

The human development would force calving caribou to move to other, less nutrient rich grounds outside of the Coastal Plain, but this would be disastrous. Caribou calf survival has been shown to be much lower in areas outside of the Coastal Plain (Johnson et al., 2005). In the late 90’s, snow cover reduced access to the foraging grounds of the Coastal Plain, forcing the Porcupine caribou herd to nearby Canada. When this happened, the calf survival rate of the herd dropped 19% (Griffith et al., 2002, p. 34).

Whether it is a good or bad thing, oil and gas are rooted in Alaskan society; oil drilling built Alaska. Much of what we know today about oil in Alaska comes from the same ANILCA research that looked into the porcupine caribou. Seismic exploration conducted to assess petroleum resources, determined that there are approximately 10.6 billion barrels of petroleum lying beneath the ANWR (U.S. Geologic Survey [USGS], 1998). For context, Alaska’s second largest oil field, Prudhoe Bay, contains only 2.5 billion barrels. (Harball, E. 2017). If drilling were to commence today, the ANWR would contribute about 2% of the total US daily oil production by 2020. By 2030, it would account for more than 10% of the US’s daily oil production. Between the years 2018 and 2030, the US would save $202 billion on foreign oil importation (Harball, E., 2016).

The impact of oil production on Alaska has been massive. Taxation on the North Slope has generated over $50 billion for the state. 80 percent of Alaska’s revenue comes from oil production. Statewide, the oil industry accounts for a third of all jobs, and is currently Alaska’s largest non-governmental industry (Alaska Oil and Gas Association [AOGA], 2017). Oil and gas generate 38% of all Alaskan wages. Even those who do not work in the oil industry benefit from Alaskan oil production. Today, Alaska’s citizens receive anywhere from $1000 to $2000 a year from the Alaska Permanent Fund. The Alaska Permanent Fund, created to ensure “all generations of Alaskans could benefit from the riches of the state’s natural resources” has paid out $21.1 billion to Alaskan residents since 1976. Oil has fueled Alaska’s meteoric rise to prominence, even catapulting the Alaska median household income to the second highest in the country (“Oil Payout”, 2015). If there was no oil, Alaska would be crippled.

A state already facing a $3 billion budget deficit, needs oil to function. With production from the North Slope already on the decline Alaska needs more oil. Alaska needs the Arctic National Wildlife Refuge. The Trans Alaska Pipeline, built to carry crude oil from Prudhoe Bay to Valdez (the northernmost point in America free of ice), stretches 48 inches in diameter. It was built this way to accommodate the large flow volumes from Prudhoe Bay, and the Arctic National Wildlife Refuge, where drilling was expected to begin shortly. At its peak, the pipeline would push almost 2 million barrels of oil a day. Today the pipeline is far below its optimum daily flow, averaging only about 515,000 barrels a day (Brehmer, E,. 2017). Around 1990, the North Slope, which supplies the bulk of the state’s oil production, peaked. Since then, oil production has been steadily decreasing and the flow through the Alaskan pipeline has been falling by 5 percent each year (Wight, P., 2017). With oil production slowing at Prudhoe Bay, the pipeline, and Alaska’s economy is in jeopardy.

With potentially ten billion barrels of oil in the 1002 region, pro-oil politicians throughout America and throughout Alaska call for the necessity to drill. They believe more drilling is the most immediate and easiest solution to the dwindling Alaskan oil production. Lisa Murkowski, the state’s senior senator and the chair of the Energy and Natural Resources Committee responsible for America’s use of natural resources, argues that oil is what has allowed for the development and upkeep of Alaskan “schools and roads and institutions”. She argues that in order to stay relevant and “to stay warm” in the face of a dwindling oil supply, drilling needs to occur in the ANWR (Friedman, 2017).

Murkowski, hoping to work around Section 1002, advocates for using Section 1003 of ANILCA which states “production of oil and gas from the Arctic National Wildlife Refuge is prohibited and no leasing or other development leading to production of oil and gas from the [Refuge] shall be undertaken until authorized by an act of Congress” (U.S. Fish and Wildlife Service [USFWS], 2014). Section 1003 basically states that ANWR can only be opened for drilling through an act of Congress.

In June, President Donald Trump announced his intention of withdrawing from the Paris climate accord, which is an international treaty focusing on fighting global warming and climate change. While other nations take steps to combat climate change, America’s current presidential administration has committed itself to fossil fuels. Donald Trump, with hopes of lessening America’s oil dependence on foreign governments, has taken up the call to open the 1002 area. The current administration has encouraged legislation that supports domestic energy expansion and has made it clear that they would like to continue America’s tradition of reliance on fossil fuels (Liptak, K., 2017).

Senate discussions led by Senator Murkowski, lean very heavily in favor of opening up the area to drilling. A referendum on the Tax Cuts and Jobs Act that was recently passed through Senate, authorizes the sale of oil and gas leases in a section of the ANWR. Soon, energy companies will be able to search for, and extract oil and gas from the frozen tundra (Meyer, R., 2017). Murkowski and the Trump administration has made ANWR drilling an almost guaranteed occurrence. With this approval of both the President and the committee chair responsible for natural resources in America, environmentalists need to recognize the real threat.

Environmentalist’s need to shift their focus from not drilling at all, to how drilling can be done in an environmentally conscious way. A practice that has the possibility to satisfy these criteria by reducing the environmental impact of oil drilling is Extended Reach Drilling (ERD). ERD is the practice of drilling non-vertical, very long horizontal wells. Extended reach drilling is a more advanced way to extract oil and is more efficient than traditional vertical well boring. Studies show that the ERD horizontal reach extends twice as far as standard vertical drilling methods (Bennetzen et al., 2010). Whereas standard reach drilling sites can only reach 4 km horizontally, an 8 km well is now considered standard depths for ERD (Finer et al., 2013). With distances of over 8 km being the norm, drill pads can be distanced at 16 km away from each other.  (“Average Depth of Crude Oil and Natural Gas Wells”, 2017) ERD wells reduce the area required to set up and drain oil reserves due to the drills extended radius. There is no need to build large amounts of drill pads to extract every oil reserve within a small area (Finer et al., 2013). Using extended reach drilling can drastically reduce the amount of land disruption caused by vertical drill wells. Habitat fragmentation, normally common around drilling sites, will be drastically reduced. Arctic caribou migration will not be affected as drastically as it would have been with standard reach drilling.

Studies from the Western Amazon have shown that half the drill pads normally used for standard reach drilling will be needed for ERD. Platforms were planned to be placed 8km away from each other, however ERD is capable of doubling that distance. All wells within a 16 km radius, were eliminated from the plan (Finer et al., 2013). The original plan consisted of 66 platforms, but 31 could be eliminated with extended reach drilling (Finer et al., 2013). Implementing ERD sites over standard platforms can save huge expanses of land from being disrupted, which directly translates to lessened environmental impacts to the ANWR.

Reducing infrastructure by using ERD sites will immediately reduce disruption of the land. Each new drilling platform requires approximately 5 to 11 acres of land, with an additional 14 acres for production phase processing stations. For example, Block 67, an area of land in the Western Amazon planned to use non-ERD sites consisting of 3 processing stations and 21 drilling platforms. This would require an environmental footprint of over 1 square kilometer. After implementing ERD sites into this scenario, 18 drilling platforms and one processing facility were eliminated, reducing land disruption by over 75% (Finer et al., 2013). ERD could preserve many acres of land for foraging caribou in the ANWR.

One concern for oil companies is the economic feasibility of using ERD platforms. Because it is a new technology, many companies are wary of its practicality. But Exxon Mobil, a leader in the world of oil production, understands it’s unique benefits. In their Russian Sakhalin-1 Project, Exxon uses ERD because they recognized the importance of the technology. To date, Exxon has drilled 43 of the world’s 50 longest-reach wells (“Extended reach technology”, n.d.). In the California OCS Santa Maria and Santa Barbara-Ventura basins, oil companies are considering using ERD to tap into 16 billion barrels of oil that lies off the California coast (California State Lands Commission [CSLC]). These oil companies would utilize ERD as an “economically and environmentally acceptable alternative” to traditional drilling sites. Fewer wells, reduced noise and air emissions, and the elimination of many new platforms incentivize these companies to use ERD. The long reach would significantly reduce the impact to the marine biology and habitats along the coast (“Oil and Gas Leases”, 2015). There would be minimal adverse effects on the environments, with most of the damage occurring in the marine survey and pre-development stage. When comparing EDR to traditional drilling, the economic benefits are enormous (Bjorklund, 2007).

With the passage of the Tax Cuts and Job Acts by the American senate and Alaska’s fossil fuel reliance, America has to prepare itself for drilling in the ANWR. America needs to understand and familiarize itself with the needs and necessities of the Arctic porcupine caribou. The caribou’s safety and livelihood must stay at the forefront of all drilling development conversations. Drilling needs to occur in the least consequential and most environmentally sustainable way possible. Extended Reach drilling is the answer. By reducing land disruption by 75%, and minimizing habitat fragmentation, ERD is the drilling practice that must be utilized to save the Arctic porcupine caribou. Alaska needs oil and the porcupine caribou need ERD.

AUTHORS

Justin Bates – Geology

Caitirn Foley – Environmental Science

Andrew Rickus – Building and Construction


REFERENCES

A brief history of the Arctic National Wildlife Refuge. (2017). Alaskawild.org. Retrieved 15 November 2017, from http://www.alaskawild.org/wp-content/uploads/2014/05/Arctic-Refuge-history-fact-sheet.1-25-17.pdf

Albert, P (April 1994). The Caribou Issue in Canadian-American Relations, Porcupine Caribou Management Board. Retrieved 1 December 2017, from http://arcticcircle.uconn.edu/ANWR/anwralbert1.html

Average Depth of Crude Oil and Natural Gas Wells. (2017). Retrieved November 28, 2017, from https://www.eia.gov/dnav/pet/pet_crd_welldep_s1_a.htm

Bennetzen, B, Fuller, J., Isevcan, E., Krepp, T., Meehan, R., Mohammed, N., . . . Sonowal, K. (2010). Extended-reach wells. Retrieved November 14, 2017, from https://www.slb.com/~/media/Files/resources/oilfield_review/ors10/aut10/01_wells.pdf


Bjorklund, T. (2007). The Case for Using Extended Reach Drilling to Develop California OCS Reserves from Onshore Locations. AAPG Database Inc., Retrieved from http://www.searchanddiscovery.com/documents/2007/07027bjorklund/


Brehmer, E., (2017). For the Alyeska team, it’s 40 years down and 40 to go. Alaska Journal of

Commerce, alaskajournal.com. Retrieved on December 1 2017, from

http://www.alaskajournal.com/2017-01-26/alyeksa-team-its-40-years-down-and-40-go#.Wh8cHrT80fF


Dyer, S., O’Neill, J., Wasel, S., & Boutin, S. 2001). Avoidance of industrial development by woodland caribou. The Journal of Wildlife Management, 65(3), 531-542. Retrieved from http://www.jstor.org/stable/3803106

Extended reach technology. ExxonMobil. Retrieved on December 2 2017, from http://corporate.exxonmobil.com/en/technology/extended-reach-technology/about/overview

Facts and Figures. (2017). Alaska Oil and Gas Association, aoga.org. Retrieved 14 November 2017, from https://www.aoga.org/facts-and-figures


Finer, M., Jenkins, C. N., & Powers, B. (2013). Potential of best practice to reduce impacts from oil and gas projects in the Amazon. PLoS ONE, 8(5), e63022. http://doi.org/10.1371/journal.pone.0063022


Friedman, L. (2017, November 1). An Alaska Senator Wants to Fight Climate Change and Drill for Oil, Too. Retrieved from https://www.nytimes.com/2017/11/01/climate/murkowski-alaska-anwr.html?_r=1

Frequently asked questions. Wilderness.nps.gov. Retrieved 15 November 2017, from https://wilderness.nps.gov/faqnew.cfm

Griffith, B., Douglas, D.C., Walsh, N.E., Young, D.D., McCabe, T.R., Russel, D.E.,…Whitten, K.R. (2002). The Porcupine caribou herd. U.S. Geological Survey, Biological Resources Division, Biological Science Report USGS/BRD/BSR-2002-0001.

Harball, E (2017). Alaska’s 40 Years Of Oil Riches Almost Never Was. npr.org. Retrieved on November 29 2017, from https://www.npr.org/2017/06/24/533798430/alaskas-40-years-of-oil-riches-almost-never-was

Harball, E., (2016). How much oil is really in ANWR?. alaskapublic.org. Retrieved on November 30, 2017, from https://www.alaskapublic.org/2016/12/07/how-much-oil-is-really-in-anwr/

Johnson, C., Boyce, M., Case, R., Cluff, H., Gau, R., Gunn, A., & Mulders, R. (2005). Cumulative effects of human developments on Arctic wildlife. Wildlife Monographs, (160), 1-36. Retrieved from http://www.jstor.org/stable/3830812

Liptak,K., (2017). WH: US staying out of climate accord. CNNpolitics, Retrieved on December 1 2017, fromhttp://www.cnn.com/2017/09/16/politics/trump-paris-climate-deal/index.html

Nellemann, C., & Cameron, R. (1996). Effects of petroleum development on terrain preferences of calving caribou. Arctic,49(1), 23-28. Retrieved from http://www.jstor.org/stable/40511982

Management of the 1002 Area within the Arctic Refuge Coastal Plain – Arctic – U.S. Fish and Wildlife Service. (2014). Fws.gov. Retrieved 15 November 2017, from https://www.fws.gov/refuge/arctic/1002man.html

Meyer, R., (2017). The GOP Tax Bill Could Forever Alter Alaska’s Indigenous Tribes. The Atlantic, theatlantic.com. Retrieved on December 2 2017, from https://www.theatlantic.com/science/archive/2017/12/senate-tax-bill-indigenous-communities/547352/

Oil and Gas Leases. (2015). California State Lands Commission, slc.ca.gov. Retrieved 15 November 2017, from http://www.slc.ca.gov/Info/Oil_Gas.html

Oil Payout: Alaskans find out how much they get (2015). Cbsnews.com. Retrieved on December 1 2017, from https://www.cbsnews.com/news/alaskans-eager-to-learn-amount-of-upcoming-oil-payout/

Maher, P (June 2017). Alaska’s Porcupine Caribou Herd – and the People it Helps Sustain. Retrieved on December 1 2017, from https://www.newsdeeply.com/arctic/articles/2017/06/09/alaskas-porcupine-caribou-herd-and-the-people-it-helps-sustain

US Department of the Interior (1987). Arctic National Wildlife Refuge, Alaska, Coastal Plain Resource Assessment. pubs.usgs.gov, pg 120. Retrieved from https://pubs.usgs.gov/fedgov/70039559/report.pdf

Why Protect Wilderness | Wilderness.org. Wilderness.org. Retrieved 15 November 2017, from http://wilderness.org/article/why-protect-wilderness

Wight, P., (2017). How the Alaska Pipeline Is fueling the push to drill in the Arctic Refuge. Yale Environment 360, e360.yale.edu. Retrieved on December 2 2017, from http://e360.yale.edu/features/trans-alaska-pipeline-is-fueling-the-push-to-drill-arctic-refuge


*The arguments/opinions expressed in this entry do not necessarily reflect the opinions/align with the author(s) own views.

The Arctic National Wildlife Reserve: Save the Caribou


Every year in April, there is a herd of nearly 197,000 caribou that travel more than 400 miles to reach the plain on Alaska’s northernmost coast. This massive herd is known as the Porcupine Caribou herd and for several months of the year, this Alaskan coastal plain will be their home. It is where the females give birth every June and where the young spend the first weeks of their lives. This area is known as the Arctic National Wildlife Refuge (ANWR) and it provides vital habitat for the Porcupine herd every spring and summer as the place where they can safely birth their calves and begin to raise them (U.S. Fish and Wildlife Service, 2016).  

The National Wildlife Refuge System was first put into place by President Theodore Roosevelt more than a century ago (“Political History of the Arctic Refuge,” 2014). Wildlife Refuges are meant to serve the sole purpose of providing and restoring habitat for animals in the wild (Berman, 2015, para. 9). Several decades later in 1954, the National Park Service began surveying areas in Alaska that would be worth protecting under the Refuge System based upon their wildlife diversity, aesthetic values, and recreational opportunities. Almost nine million acres in the northeastern corner of Alaska were deemed valuable according to these standards and in 1960, ANWR was established. Today, this preservation area has expanded to nearly 19 million acres. The Refuge is home to a diverse collection of wildlife that includes eight types of marine mammals, 37 species of land mammals, 42 fish species, and over 200 bird species with its most notable species being caribou, polar bears, and muskoxen (U.S. Fish and Wildlife Service, 2013).

The northernmost piece of the ANWR is a one and a half million acre plain that borders the coast of the Arctic Ocean. This particular part of the Refuge is referred to as the 1002 area (U.S. Geological Survey, 2016). Currently, it is not considered Wilderness because it is a vast frozen coastal plain without trees, mountains, or lakes (Energy Research, n.d.). However, this is the esteemed coastal plain that the Porcupine Caribou herd migrates to each spring and relies upon as the habitat in which more than 40,000 calves are born each year (U.S. Fish and Wildlife Service, 2016; Warden and Johnson, 2015).

Unfortunately, the 1002 area in the ANWR has been being considered for oil exploration since 1980. Today, there is a strong push being made by Alaskan politicians to open up this area for oil drilling. It is estimated that this coveted coastal region holds anywhere from four to twelve billion barrels of oil (Reiss, 2017). According to the U.S. Geological Survey (2016), approximately 10.4 million barrels of this oil are actually recoverable, which translates into about one million barrels per day for the 1002 area. Based on these estimates, ANWR would be producing more oil than any other field in North America. Within the ANWR, 7.16 million acre are currently protected under the Wilderness Act and that does not include the 1002 area (Energy Research, n.d.).

One of the most outspoken proponents for drilling in the ANWR is Alaska’s Republican senator, Lisa Murkowski. She is fighting hard for the rights to drill in the 1002 Area of ANWR as a means to boost the Alaskan economy (Murkowski, 2017). Murkowski argues that opening the 1002 Area to drilling would lead to a massive increase in jobs available for Alaskans and that it will mean billions of dollars of revenue for the state as well (Murkowski, 2017, para. 6). While oil drilling may benefit the state in the short term, it would only make Alaskans more dependent on fossil fuels at a time when the fossil fuel industry is becoming less and less popular (Grant, 2017, para. 3). Meaning that in the long run, the jobs created now for drilling would not last as less oil becomes used worldwide and greener technologies emerge to take its place. In addition to this, the drilling would also create a series of negative impacts to the environment that include excessive noise levels, slow ecological recovery, emissions, and sea ice danger.

The negative ecological effects of oil drilling in the ANWR 1002 area far outweigh the benefits, therefore it should be declared a Wilderness area in order to protect wildlife and the environment from the impacts of drilling activities. The distinction of Wilderness gives the strictest regulations possible for public land protection. Becoming designated Wilderness would make it illegal to drill for oil in the 1002 area (Sanders, 2015, para. 3). Keeping oil rigs out of the area would prevent harm to the caribou herds and other wildlife that rely on the 1002 area for habitat because they would not have to migrate elsewhere to avoid the noise levels and pollution. The Porcupine caribou are an important part of the ecosystem of the 1002, both depending on the environment they live in as well as enriching it (PCMB.ca, 2017).

Ecologically, we should care because of the negative effects oil exploration and drilling will have on the surrounding ecosystem. Noise pollution from oil fields in the 1002 area causes the Porcupine Caribou to cease migration to the coastal plains for calving season. When noises from the drilling exceed 75 decibels, many animals are unable to tolerate it and will avoid those areas (Drolet, Côté, and Christian , 2016). Thus, oil drilling will cause a decrease in the caribou population because it would drive them away from the calving grounds that they have relied upon for generations to raise their young in. Caribou are one of the most prominent animals in the northern Alaskan landscape. One study simulated what would happen to their populations if onshore oil rigs develop near their habitat. The study found that when subjected to the harshest development scenario of 15 rigs, all open for leasing, the caribou lost 34% of their habitat used for calving grounds when they were forced out of it by drilling the effects (Wilson et al., 2015). Excessive noise levels from the drilling activity causes these animals to migrate from their high-quality sites into areas that are less suitable for their needs (Drolet et al., 2016).

According to Griffith et al. (2002), pregnant female caribou will not cross over or under oil industry infrastructure during calving season (p. 40). This creates a large problem since the females are usually pregnant when they migrate to Area 1002 every June (U.S. Fish and Wildlife Service, 2016, para. 4). This could mean that they are unable to reach the area and may not be able to properly give birth and raise healthy calves. Additionally, caribou forced to migrate from their habitat in the safe coastal plains to the mountains may likely run into many more predators, such as grizzly bears and wolves. According to Griffith et al. (2002), grizzly bears’ habitat is primarily in the mountainous foothills and there has never been a report of wolf dens on the coastal plains (p. 51). Without trees or mountains in the 1002 area, these animals are not very present on the plain, thus making it safer for the caribou to be there than further inland where those predators are more abundant.

The environment in the ANWR is very sensitive to anthropogenic disturbances due to the brutal climate that allows for a short growing season for vegetation to recover from any damage. This slow ecological recovery puts the wildlife, such as the caribou previously discussed, in danger of not having enough food supply. The anthropogenic changes in the ANWR will be detrimental to the vegetation, like grasses, mosses and small shrubs. The pollution released by these oil sites causes death or illnesses that eventually lead to death to surrounding animals (Arctic National Wildlife Refuge, 2016). Therefore, the overall pollutants from oil exploration have negative impacts on both the habitat and migration of wildlife in the ANWR 1002 area.

Being how remote and wild this land truly is, it is not often traveled. This is also true for Prudhoe Bay, where there is currently oil drilling occurring. According to Barringer (2006), there was a spill comprised of 267,000 gallons of crude oil across two acres along Alaska’s North Slope (para. 1). The spill took five days to detect due to it starting as pin sized hole that expanded under pressure and most of the oil seeping under the snow (Barringer, 2006, para. 3-4). Inspections of the pipe showed that the almost 40 year old pipe had increased corrosion but not enough to worry about. The leak was also too small for system to detect so nobody knew (Barringer, 2006, para. 9-10). This is not the only spill from this pipeline however, there was an 11 million gallons spill in 1989, a 700,000 gallon spill in 1978 and a 285,000 gallon spill in 2001 (para. 7). Spills happen no matter how careful the companies are. A spill like this could force the Porcupine Caribou out of even more of their habitat.

Oil drilling in the ANWR would have economical value to Alaska, however in the grand scheme this value is outweighed greatly by the negative ecological impact it would have. The noise from the oil rigs is too loud for the Porcupine Caribou herd to tolerate and would force them out of their environment (Drolet et al., 2016). This would also disrupt their migration patterns because a pregnant female will not cross under or over any oil infrastructure (Griffith et al., 2002, p.40). This makes the routes that they can take even more selective if not impossible. In addition the herd would have to move into the mountains, where their predators are, which would lead to fewer offspring surviving (Griffith et al., 2002). If all of this still isn’t enough the herd could end up running out of food. The Arctic has a slow ecological recovery with a very short growing season due to the nature of the climate (Arctic National Wildlife Refuge, 2016). Not only is their land being taken by the oil rigs, but also their food sources. Making the ANWR completely designated as Wilderness would make drilling illegal (National Parks, 2012, para. 6) protect this herd for years to come while also preserving the pristine piece of land that is truly left without human interference.

AUTHORS

Adam Mergener – Building Construction Technology

Ashley Casello – Natural Resource Conservation

Kevin Boino – Environmental Science


REFERENCES

Arctic National Wildlife Refuge. (2016, September 19). Retrieved from http://www.defenders.org/arctic-national-wildlife-refuge

Barringer, F. (2006, March 15). Large Oil Spill in Alaska Went Undetected for Days. Retrieved from http://www.nytimes.com/2006/03/15/us/large-oil-spill-in-alaska-went-undetected-for-days.html

Berman, A. (2015, September 28). Park vs. refuge: What’s the difference? Retrieved from  https://www.mnn.com/earth-matters/wilderness-resources/stories/park-vs-refuge-whats-difference

Drolet, A., Côté, S. D., & Christian, D. (2016). Simulated drilling noise affects the space   use of a large terrestrial mammal. Wildlife Biology, 22(6), 284-293. doi://dx.doi.org/10.2981%2Fwlb.00225

Energy Research, I. F. (n.d.). ANWR. Retrieved from https://instituteforenergyresearch.org/topics/policy/anwr/

Grant, M. (2017, October 19). Oil Drilling in Arctic National Wildlife Refuge Imperils Wildlife, Won’t Solve Economic or Energy Challenges. Retrieved from http://www.nwf.org/Home/Latest-News/Press-Releases/2017/10-19-17-Arctic-Oil-Drilling

Griffith, B., D. C. Douglas, N. E. Walsh, D. D. Young, Jr., T. R. McCabe, D. E. Russell, R. G. White, R. D. Cameron, and K. R. Whitten. 2002. The Porcupine caribou herd. Pages 8-37 in D. C. Douglas, P. E. Reynolds, and E. B. Rhode, (eds.). Arctic Refuge coastal plain terrestrial wildlife research summaries. USGS Biological Science Report USGS/BRD/BSR-2002-0001

Murkowski, L. (2017, November 01). Time is right to open a slice of ANWR to drilling. Retrieved from https://www.adn.com/opinions/2017/11/01/time-is-right-to-open-a-slice-of-anwr-to-drilling/

National Parks, National Forests, and U.S. Wildernesses. (2012, April 18). Retrieved from http://www.pbs.org/wnet/nature/river-of-no-return-national-parks-national-forests-and-u-s-wildernesses/7667

Pcmb.ca. (2017). Porcupine Caribou Management Board. Available at: http://www.pcmb.ca.

Political History of the Arctic Refuge. (2014, November 23). Retrieved from http://anwr.org/2014/11/political-history-of-the-arctic-refuge/

Reiss, B. (2017, September 15). Bolstered by Trump, big oil resumes its 40-year quest to drill in an Arctic Wildlife Refuge. Fortune. Retrieved from http://fortune.com/2017/09/15/donald-trump-big-oil-alaska-arctic-wildlife-refuge/

Sanders, S. (2015, January 25). Obama Proposes New Protections for Arctic National Wildlife Refuge. Retrieved from https://www.npr.org/sections/thetwo-way/2015/01/25/379795695/obama-proposes-new-protections-for-arctic-national-wildlife-refuge

U.S. Fish and Wildlife Service. (2013). Arctic: Wildlife & habitat. Retrieved from http://www.fws.gov/refuge/arctic/wildlife_habitat.html

U.S. Fish and Wildlife Service. (2016, December 6). Caribou – Arctic – U.S. Fish and Wildlife Service. Retrieved from https://www.fws.gov/refuge/arctic/caribou.html

U.S. Geological Survey. (29 November 2016). Arctic National Wildlife Refuge, 1002 Area, Petroleum Assessment, Including Economic Analysis. Retrieved from https://pubs.usgs.gov/fs/fs-0028-01/fs-0028-01.htm

Warden, A. and Johnson, D. (2015). Wilderness is the right designation for ANWR’s coastal plain. Alaska Dispatch News. Available at: https://www.adn.com/commentary/article/keep-arctic-refuge-wild/2015/12/18/

Replace Hydropower Dams to Save the Southern Resident Orca Whale Population!


On August 8th 1970, the southern resident orca whale population was ambushed off the coast of Penn Cove, Washington in one of the most infamous whale captures in history (WDC, 2017). This capture involved 80 whales, in which 7 were collected and 5 were killed (WDC, 2017).  The only current living orca from this incident is Lolita (WDC, 2017). She is now the oldest living killer whale in captivity and lives in what is arguably too small of a tank (Save Lolita, n.d; Herrera, 2017). It’s believed that Lolita’s tank doesn’t meet the minimum 48 feet horizontal dimension requirement set by the United States Department of Agriculture (USDA) (Herrera, 2017). Lolita has a 60 foot tank obstructed by a ‘work island’ that separates her pool into two 35 feet sections (Herrera, 2017). Another issue Lolita faces in captivity is solitude (which is abnormal for social animals such as orcas) (Save Lolita, n.d). Due to animal rights advocacy groups making these issues well known to the public, Lolita has become both a symbolic example for why orcas can’t feasibly be kept in captivity and a famous icon for the southern resident orca population. This killer whale population is currently estimated at 80 whales consisting of 3 pods named the J,K and L pods (NOAA Fisheries, 2015). In the fall, spring and summer their territory ranges from waterways near the U.S.-Canadian border to inland waterways in Washington state ( NOAA Fisheries, 2015).

The southern resident orca whale population is also vital for Washington state’s economy. These whales benefit the state’s economy by providing tourism revenue through whale watching (Grace, 2015). The number of people going on whale watches in Washington has even increased over time; from 1998 to 2008, Washington state saw an increase of 108,000 whale watchers and a 3% average annual growth rate (O’Connor, 2009). Due to this increased whale watching tourism, wildlife watching activities (such as whale watching) created over 21,000 jobs in Washington State, yielded $426.9 million in job income, and generated $56.9 million in state tax revenue all in 2001 (Grace, 2015, para. 4). People are also estimated to spend nearly $1 billion annually in Washington viewing wildlife (O’Malley, 2005, para. 1). It’s also estimated that the southern resident orca population itself adds minimally 65-70 million dollars to Washington state’s economy (Grace, 2015, para. 1).

Sadly though, despite all the intrinsic and economic benefits these orcas bring to Washington state, they are facing the threat of extinction. In fact, the southern resident orca population was even added to the endangered species list in 2005 (NOAA fisheries, 2015).They were added to this protection list because the population has fallen from an estimated 200 whales in the late 1800s to a current estimate of 80 whales (NOAA Fisheries, 2015). This population decline even lead to the production of a recovery plan by the National Marine Fisheries Services (National Marine Fisheries Service, 2008). This plan addresses specific potential threats to the southern resident orca population such as prey availability, pollution, vessel effects, oil spills, exetera and outlines goals to minimize these threats and their harm to orcas (National Marine Fisheries Service, 2008). One of the believed reasons behind the orcas small population size is a limited abundance of salmon from the Snake and Columbia rivers (Baker & Peterson, 2017). The southern resident orcas rely on Columbia and Snake river salmon as a food source during the summer when they live in waters off the San Juan Islands that lie northwest of Seattle (Baker & Peterson, 2017). Salmon are an essential food source for these whales because resident killer whales only prey on fish, not other marine mammals (such as seals or sea lions) (Ford et al., 1998, 2009). The Columbia River itself is also especially crucial for southern resident orcas as they display unique feeding behavior there not seen at any other territorial location; they stock up on salmon by sitting at the mouth of the river for days and foraging (Baker & Peterson, 2017). It’s also believed the declining salmon population is a key reason behind the southern resident orcas low population because orcas are predators at the top of their ecosystem’s food chains and don’t serve as prey for other animals (Ford, 2009). Therefore, predation of orcas cannot be considered a valid source for their population decline. As a result, the decreasing salmon population in the Columbia and Snake Rivers has added pressure to the orca population over the past three decades (Baker & Peterson, 2017). The Center for Whale Research and the Center for Conservation Biology (University of Washington) found that low salmon populations also lead to enough nutritional stress to cause two-thirds of  southern resident orca pregnancies to fail between 2007 and 2014 (Baker & Peterson, 2017).The majority of the salmon this whale population consumes also originates from the Snake river, a tributary of the Columbia River (Barker & Peterson, 2017). In short, the southern resident orca population is critically endangered and low salmon populations are putting even more stress on the whales (Barker & Peterson, 2017; Ford 2009). If the northwest salmon population is not restored, it could result in the disappearance of resident orcas in the northwest forever.   

Since 1991, twelve specific populations of Columbia River Basin salmon and steelhead have been protected under the Endangered Species Act (Harrison, 2016). For Snake River Salmon the National Marine Fisheries Service noted that the estimated annual returns of spring/summer Chinook declined from 125,000 fish between 1950 and 1960 to just 12,000 fish in 1979 (Harrison, 2016). Proposed recovery plans have also started legal battles over what actions are necessary to avoid further jeopardizing the species (Harrison, 2016). This debate is complicated by hydropower dams directly affecting salmon and steelheads (Harrison, 2016). These hydropower dams on the Columbia and Snake rivers are inhibiting growth of the river’s salmon population by creating habitat fragmentation, causing direct mortality and decreasing their food supply (Harrison, 2008).

At 1,954 kilometers long, the Columbia river is the 15th longest river in North America; its tributaries and it form the dominant water system in the Pacific Northwest as it drains into seven different western states (Bonneville Power administration , 2001). The history of the dams on the Columbia and Snake rivers date back to Theodore Roosevelt’s presidency, as the construction of the first dam on the Columbia river (the Rock Island dam) began shortly after his election with the sole intention of producing electricity (Harrison, 2008) . By 1975 the Columbia river had four more large dams constructed on it and has had smaller dams constructed on it since (Harrison, 2008).  

These dams inhibit the river’s salmon population because they fragment rivers and therefore impede salmon migration. This negatively impacts the reproduction of the Columbia and Snake river salmon because they then cannot spawn effectively upstream. Salmon need to navigate between spawning sites, rearing habitat (juvenile living space) and the Pacific Ocean in order to reproduce. Salmon hatch in rivers and then travel to the ocean for their adult lives  (National Park Service’s, 2017). Then when they are ready to spawn again, instincts guide them back to their birthplace to spawn (National Park Service’s, 2017). There are also case studies to show that dams, like the ones present in the Snake and Columbia river, prevent the salmon from properly spawning upstream. For example, the presence of the Hemlock Dam on Trout Creek, Washington, USA was linked to the impeded migration of  U.S. threatened Lower Columbia River steelhead (a type of salmon) and other migratory fish by blocking their migration path (Claeson & Coffin, 2016, p. 1144). It is also known that the dams in the Columbia river basin now block more than 55 percent of the spawning and rearing habitat once available to salmon and steelhead (Harrison, 2008).

Dams not only block the upstream passage of adult fish but block the downstream passage of juvenile fish as well. Hydroelectric dams (such as the ones on the Columbia and Snake rivers) compound this problem because they force migrating fish to travel through turbines without a bypass systems (Harrison, 2008). This is a problem for migrating salmon because the spinning blades and/or concrete walls in these turbines could kill or injure juvenile fish drawn in by the current (Harrison, 2008). Biologists estimate that fish drawn through a turbine passage has a 10 to 15 percent chance of dying (Harrison, 2008). This is problematic due to the Snake and Columbia river having multiple hydroelectric dams that increase each fish’s chance of dying by forcing them to travel through turbines to migrate (Harrison, 2008).

The dam’s on the Columbia and Snake rivers are also negatively impacting the salmon populations chance of survival by limiting their sources of food. The hydroelectric dams are doing this by limiting the growth of benthic insects (mayflies,stoneflies, caddisfly nymphs) populations within the rivers. Dams are known to limit benthic insect population growth by increasing water temperatures (Claeson & Coffin, 2016).  Dams increase water temperatures by creating reservoirs that isolate water and create a slow flow over the dam that increases the reservoir’s water and discharge temperature (Claeson & Coffin, 2016). In warmer waters, desirable salmon food sources such as mayfly, stonefly and caddisfly nymphs die off and are replaced by other insects (midges and mosquito larvae) that are much less desirable as food for salmon (Effects of Elevated Water Temperatures on Salmonids, 2000).  Cold water fish such as salmon relay on benthic insect populations as a source of food and decreasing benthic insect populations makes an environment unsuitable for salmon to live in (Claeson & Coffin, 2016, Harrison, 2008).  

The best plan to solve this problem and save both the salmon and orca whale population would be to remove the dams from the Columbia and Snake rivers. Removing the dams would help restore the salmon population that the southern resident orcas so heavily rely on. There have been previous dam removals in the Columbia and Snake river area that have resulted in a successful increase in salmon population. In 2012, removing the Condit Dam from the White Salmon River (a tributary to the Columbia River) restored upstream migration access for the first time in 100 years (Allen et al., 2016, p.192). The number of redd counts (the number of salmon spawning nests) shows the increase in the salmon population (Allen et al., 2016, p.197). In the pre-dam model for the Tule fall Chinook Salmon it’s redd count increased by 60% since dam removal and the Upriver bright fall Chinook Salmon redd count increased from no abundance to around 4,251 redds after dam removal in 2013 (Allen et al., 2016, Table 2). This dramatic increase in spawning means a greater number of salmon are being produced. Other large dam removals include Washington State’s Glines Canyon Dam and the Elwha Dam hydroelectric dam. These dams were removed in 2011 (Nijhuis, 2014). Now salmon can be seen migrating past the former dam sites and as salmon populations recover, research expect the whole food web to benefit (Nijhuis, 2014). These cases set forth by the Condit, Glines Canyon and Elwha Dam removal is further evidence that dam removal in the region can be beneficial to the salmon population.

While these cases have made it clear that dam removal is the best option to restore the salmon population, there are other options available. Alternative methods such as a permanent adult fish ladder can be seen on the Lower Granite Dam (Conca, 2016). However, fish ladders can be problematic because they elevate water temperatures to form a “thermal barrier” that stops adults from migrating upwards into warm waters (Conca, 2016). One method the US Army Corps of Engineers attempted to face this problem was releasing Dworshak reservoir water in to cool the Snake River (Lower Granite Adult Fish Ladder Temperature Improvement System, 2016). Another alternative method is  “daylighting” juvenile fish passage (Conca, 2016).  This is when  juvenile fish passage is allowed through a large elevated bypass flume leading to the Juvenile Fish Facility just downstream of the dam (Conca 2016). Save Our Wild Salmon (a nationwide coalition working to restore salmon and steelheads to the rivers) also argues that the federal government is relying on these unreliable alternative methods such as barging and trucking salmon around the dams and limiting the amount of water in the river (Bogaard, 2017). Implementing these alternative methods have already cost billions of dollars to the US taxpayers and over the past twenty years, researchers still also haven’t found conclusive evidence that federal salmon recovery actions succeeded in helping restore these fish (Bogaard, 2017). Federal agencies have spent more than $8 billion in attempts to restore Columbia and Snake River salmon (Bogaard, 2017). Each year more than $550 million in funding goes to NOAA Fisheries, the Army Corps of Engineers and other federal agencies for this effort (Bogaard, 2017). Removing these dams could be cheaper than these other restoration efforts and revive both the salmon and orca populations. Advocates for dam removal also argue that the removal of these dams is a viable option because they produce most of their power in the spring when it’s not crucial for Northwest power supplies, and it would be relatively simple and inexpensive when comparing the cost to other alternative methods  (Baker & Peterson, 2017).

The main reason some are still resistant to removing these dams is because they provide a significant source of hydropower. There are four main hydroelectric power providing dams on the Snake river; these are the ICE Harbor, Lower Monumental, Little Goose and Lower Granite Dams (Conca, 2016). According to Conca (2016) Ice Harbor Dam produces 1.7 billion kWhs/yr, Lower Monumental dam produces 2.3 billion kWhs/yr, Little Goose dam produces 2.2 billion kWhs/yr and Lower Granite dam produces 2.3 billion kWhs/yr. (Conca, 2016). Washington’s hydroelectric power provides more than two-thirds of Washington’s net electricity generation and almost nine-tenths of the state’s renewable power generation (U.S Energy Information Administration, 2017). As for the Columbia river, The Grand Coulee Dam is the largest hydroelectric power producer in the United States, with a total generating capacity of 6,809,000 kilowatts (U.S Energy Information Administration, 2017). The communities that depend on the Snake and Columbia river’s hydroelectric dam power are then faced to question if there are potential ways to provide Washington state a renewable energy source that doesn’t hurt the salmon population . To end this debate an alternative energy source (specifically wind energy) needs to replace the hydropower provided by the dams on the Snake and Columbia river so that the dams may be removed.

This replacement energy source absolutely needs to be renewable because Washington passed renewable energy standard (RES) legislation in 2006 that requires certain utilities to have fifteen percent of their electricity sales from renewable resources by 2020 and to invest in energy efficiency (American Wind Energy Association, 2014). One viable, renewable energy source that may be used to replace hydroelectric power provided by these dams would be wind energy. In fact, in 2015 Washington ranked ninth in the nation in wind energy electricity generation (U.S Energy Information Administration, 2017). There are still some skeptics regarding the reliability of wind turbines and their ability to produce enough power to feasibly replace other energy sources.  For example, some claim that wind turbines are unpredictable, not dependable enough for consistent power generation and only produce 8% of their total system capacity (Edmunds, 2014).  However, this is mostly incorrect and invalid in this case. Wind energy has already proven itself feasibly reliable in Washington, it’s the state’s second largest renewable energy generation contributor with over 3,000 megawatts of installed capacity (U.S Energy Information Administration, 2017). This can be compared to the 6,910 megawatts of hydroelectricity generated Washington net electricity (U.S. Energy Information Administration – EIA – Independent Statistics and Analysis, 2017). Wind energy is also relied upon as a common renewable resource of choice to meet renewable energy legislation requirements (American Wind Energy Association, 2014).

New wind turbine farms to replace the hydroelectric dams can be installed by PSE (Pudget Sound Energy), the largest Northwest utility producer of renewable energy (Hopkins Ridge Wind Facility). They own and operate the large wind farms including the Hopkins Ridge Wind Facility located in Columbia County (Hopkins Ridge Wind Facility). The Hopkins Ridge Wind Facility started in 2005 and consists of 87 turbines  producing an average annual output of about 465,000 megawatt hours, sufficient to power 41,000 households (Hopkins Ridge Wind Facility). If more winds farms like Hopkins Ridge Wind Facility were developed to help the state of Washington develop more wind energy, the people of Washington wouldn’t need the hydroelectric power provided by the dams and they could be removed to help prompt orca and salmon population recovery.

The best possible solution for this issue is to harness and develop more wind energy in the state of Washington. This energy replacement will allow for the dams to be removed without depriving the people of Washington of electricity. Being able to remove these dams is critical for the survival of the salmon population within the Columbia and Snake rivers. Sustaining the salmon population is critical for the survival of the southern resident orca population (a beloved tourist attraction in the state of Washington). Saving the salmon population will also help the National Marine fisheries service in achieving the recovery plan outlined for southern resident orca whales in 2008 (National Marine Fisheries Service. 2008).  In short, finding an alternative renewable energy source to replace the dams on the Columbia and Snake rivers is imperative for the survival of the salmon and orca whale populations affected by these dams. Lolita the orca was taken from this population and is now suffering as a result (Save Lolita, n.d.; WDC, 2017). She serves as an example of how hard captivity is for orcas and why preserving the southern resident population in the wild is their only true chance for survival.

AUTHORS

Marilyn Donovan – Animal Science: Pre-vet

Lauren Baldwin – Environmental Science

Connor Taylor – Environmental Science

REFERENCES

Allen, M. B., Engle, R. O., Zendt, J. S., Shrier, F. C., Wilson, J. T., & Connolly, P. J. (2016).  Salmon and steelhead in the white salmon river after the removal of                   Condit Dam–Planning efforts and recolonization results. Fisheries, 41(4), 190-203. doi:10.1080/03632415.2016.1150839

American Wind Energy Association. (2014, August 12). State wind energy statistics: Washington. Retrieved from http://awea.files.cms-plus.com/FileDownloads

             /pdfs/washington.pdf

Barker, R., & Peterson, B. (2017, July 10). Fate of the Pacific Northwest orcas is tied to having enough Columbia River salmon. Retrieved November 05, 2017, from

                http://www.tri-cityherald.com/news/local/article160618424.html

Bogaard, J. (2017). Why Remove The 4 Lower Snake River Dams? Retrieved November 30, 2017, from http://www.wildsalmon.org/facts-and-information/why-

                remove-the-4-lower -snake-river-dams.html

Bonneville Power administration , U.S. bureau of reclamation, U.S. army corps of engineers. (2001, April). THE COLUMBIA RIVER SYSTEM INSIDE STORY.                       Retrieved November 13, 2017, from https://www.bpa.gov/power/pg/columbia_river_inside_story.pdf

Claeson, S. M., & Coffin, B. (2016). Physical and biological responses to an alternative removal strategy of a moderate?sized dam in Washington, USA. River                             Research and Applications,  32(6), 1143-1152. doi:10.1002/rra.2935

Conca, J. (2016, December 01). Will Removing Large Dams On The Snake River Help Salmon?  Retrieved November 05, 2017, from                                                                         https://www.forbes.com/sites/jamesconca/2016/11/29/  will-removing-large-dams-on-the-snake-river-help-salmon/#6a09e204155b

Edmunds, D. R. (2014, October 27). Study: Wind Turbines are ‘Expensive, Unreliable and  Inefficient’. Retrieved November 30, 2017, from                                                           http://www.breitbart.com/london/2014 /10/27/government-is-whistling-in-the-wind-on-practical-case-for-wind-power/

Effects of Elevated Water Temperatures on Salmonids. (2000, July). Retrieved December 3, 2017, from                                                                                                                            https://fortress.wa.gov/ecy/publications/publications/0010046.pdf

Ford, J. K., Ellis, G. M., Barrett-Lennard, L. G., Morton, A. B., Palm, R. S., & Iii, K. C. (1998). Dietary specialization in two sympatric populations of killer whales                     (Orcinus orca) in coastal British Columbia and adjacent waters. Canadian Journal of Zoology, 76(8),  1456-1471. doi:10.1139/cjz-76-8-1456

Ford, J. K., Ellis, G. M., Olesiuk, P. F., & Balcomb, K. C. (2009). Linking killer whale survival and prey abundance: food limitation in the oceans apex predator?                         Biology Letters, 6(1), 139-142. doi:10.1098/rsbl.2009.0468

Grace, S. (2015, September 29). Economic Value. Retrieved November 26, 2017, from  https://srkwcsi.org/the-economic-value-of-southern-resident-killer-                               whales/

Harrison, J. (2008, October 31). DAMS: IMPACTS ON SALMON AND STEELHEAD.  Retrieved November 14, 2017, from                                                                                           https://www.nwcouncil.org/history/DamsImpacts

Harrison, J. (2016, May 4). ENDANGERED SPECIES ACT AND COLUMBIA RIVER SALMON AND STEELHEAD. Retrieved November 14, 2017, Retrieved from                   https://www.nwcouncil.org/history/EndangeredSpeciesAct

Herrera, C. (2017, June 7). Lolita’s tank at the Seaquarium may be too small after all, a new USDA audit finds. Retrieved December 01, 2017, from                                                  http://www.miamiherald.com/news/business/article154928954.html

Hopkins Ridge Wind Facility. (n.d.). Retrieved November 30, 2017, from https://pse.com/aboutpse/EnergySupply/Pages/Wind-Power.aspx

Lower Granite Adult Fish Ladder Temperature Improvement System. (2016, May 25). Retrieved  December 3, 2017, from                                                                                                                                                                                                                                                                                                                                        http://.nww.usace.army.mil/Portals/28/docs/programsandprojectsandprojects/Granite%20temp%20Improvement/FS_160525LowerG_LadderTempImprovementFinal.pdf 

National Marine Fisheries Service. (2008). Recovery Plan for Southern Resident Killer Whales

                 (Orcinus orca). National Marine Fisheries Service, Northwest Region, Seattle,Washington.

Nijhuis, M. (2014, August 27). World’s Largest Dam Removal Unleashes U.S. River After

                 Century of Electric Production. Retrieved December 3, 2017,from https://news.

                 nationalgeographic.com/news/2014/08/140826-elwha-river-dam-removal-salmon-science-olympic/

NOAA Fisheries. (2015, January 08). Killer whale (Orcinus orca). Retrieved December 02,

                  2017, from http://www.nmfs.noaa.gov/pr/species/mammals/whales/killer-whale.html

O’Connor, S., Campbell, R., Cortez, H., & Knowles, T. (2009). Whale Watching Worldwide: tourism numbers, expenditures and expanding economic benefits, a                       special report from  the International Fund for Animal Welfare, Yarmouth MA, USA, prepared by Economists at Large. Retrieved from                                                   http://www.ifaw.org/sites/default/files/whaleWatchingworldwide.pdf

O’Malley, M. F., (2005). Wildlife Viewing Recreation: Economic Stimulant and Habitat Protection Tool. Retrieved from                                                                                                 http://depts.washington.edu/uwconf/2005psgb /2005proceedings/papers/E10_OMALL.pdf

Save Lolita, Raising Awareness for Lolita the Orca. (n.d.). Retrieved December 1, 2017, from https://www.savelolita.org/

The Salmon Life Cycle. (n.d.). Retrieved December 03, 2017, from https://www.nps.gov/olym/learn/nature/the-salmon-life-cycle.htm

U.S Energy Information Administration. (2017, November 16). Washington – State Energy

                  Profile analysis – U.S. Energy Information Administration (EIA). Retrieved from https://www.eia.gov/state/analysis.php?sid=WA

U.S. Energy Information Administration – EIA – Independent Statistics and Analysis. (2017, July). Retrieved December 03, 2017,

                   from https://www.eia.gov/state/?sid=WA#tabs-4

WDC. (2017). The Fate of Captive Orcas. Retrieved December 01, 2017, from http://us.whales.org/wdc-in-action/fate-of-captive-orcas

What the Frack? Fracking Threatens the Environment With Methane Leakage

(University of Michigan, 2013)

Wellsboro, a rural Pennsylvania town of roughly 3,200 residents, wasn’t doing very well economically (Hurdle 2010). Local farms were heavily in debt, motels frequently had occupancy under 40% outside of the tourism season, and many residents earned $12,000 less each year than the state average (Hurdle 2010). All of that started to change in 2008, when farmers started to receive checks of $375,000 or more, catapulting them back into financial solvency (Hurdle 2010). Then the railroad started to pick up, breaking out of more than 20 years of stagnation and doubling its yearly revenue (Hurdle 2010). Following the increase in rail traffic was a similar increase in traffic on the roads, so much so that residents were concerned the roads wouldn’t be able to take it (Hurdle 2010). Motels regularly filled up during the normally quiet winter and other businesses saw a similar increase in customers (Hurdle 2010). What could have caused an economically insignificant town like Wellsboro to experience such a reversal of fortunes? The answer was simple: fracking.

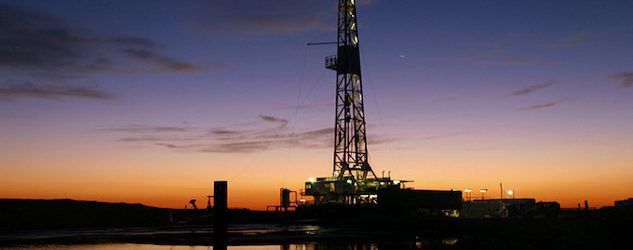
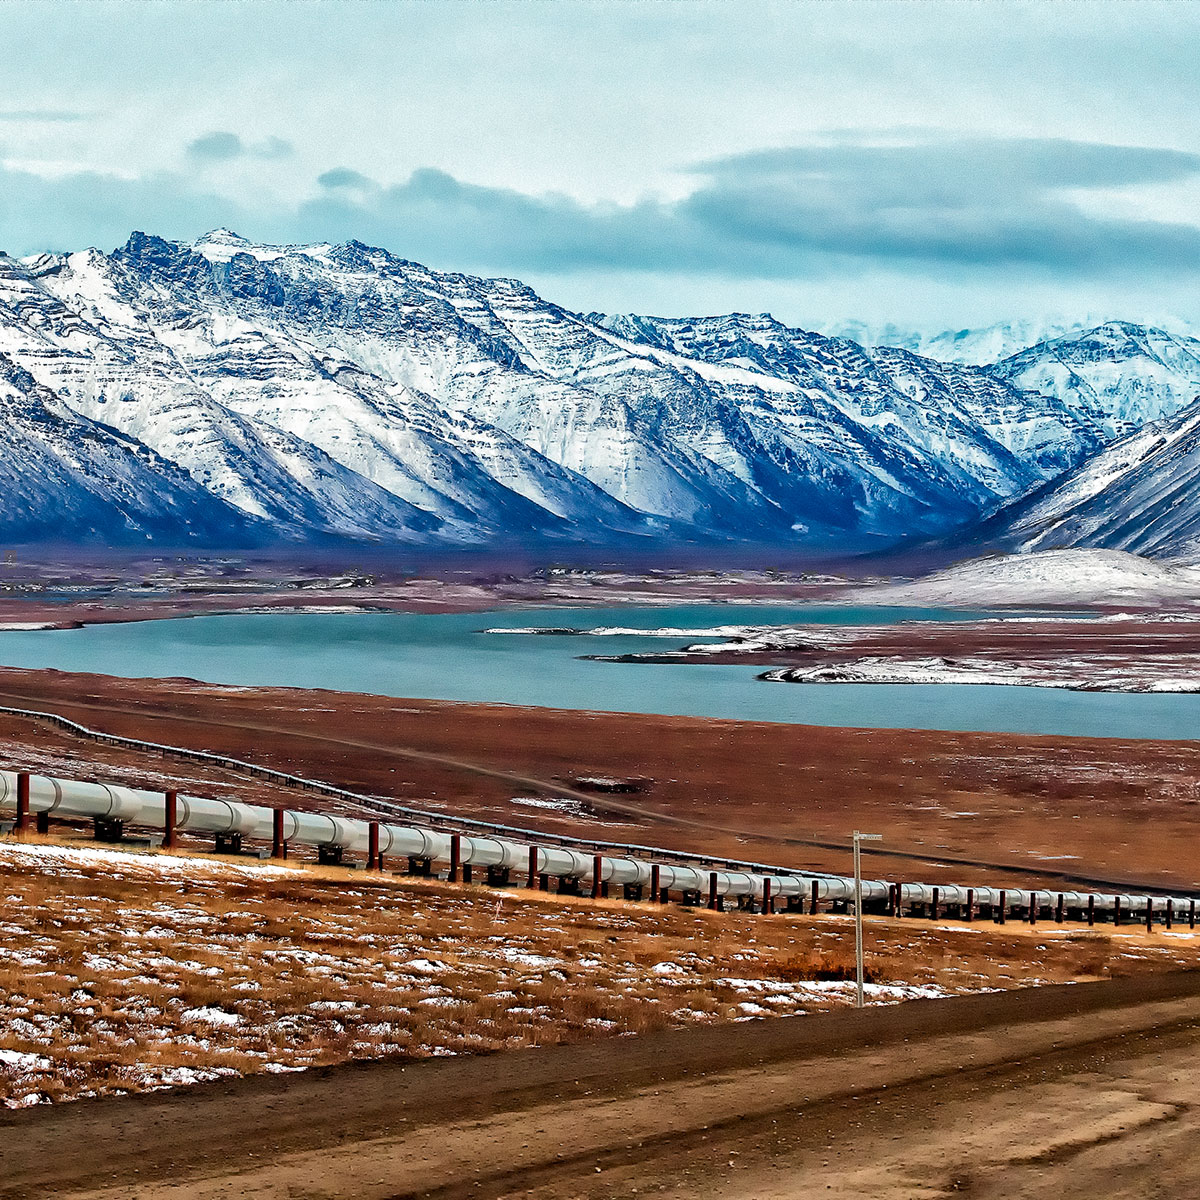
“Fracking”, a common nickname for hydraulic fracturing, is a relatively new form of unconventional gas production (EPA 2017). By injecting a solution of water and various additives into a wellbore at high pressure, surrounding rock formations are fractured, allowing trapped oil or natural gas to escape (EPA 2017, Allen et al., 2013, p. 17768). Once the initial injection is complete, the naturally pressurized gas flows back to the wellbore (EPA 2017). With the gas comes some of the injected fluid, which may now contain naturally occurring materials such as brines, metals, radionuclides, and hydrocarbons (EPA 2017). This returning liquid is known as “flowback”, and is a waste product that is collected for recycling or disposal (EPA 2017). The flowback is contained to prevent the aforementioned materials and some of the methane gas from escaping into the environment (Allen et al., 2013, p. 17769). After the flowback is dealt with, the natural gas escaping from the wellbore can be captured and later sold. Fracking has allowed the extraction of gas from previously inaccessible rock formations such as tight sandstone, shale, and some coal beds (EPA 2017). Wellbores can be vertically drilled hundreds or thousands of feet underground, and can include additional horizontal drillings that extend thousands of feet to help reach the gas dispersed throughout the rock formations (EPA 2017).

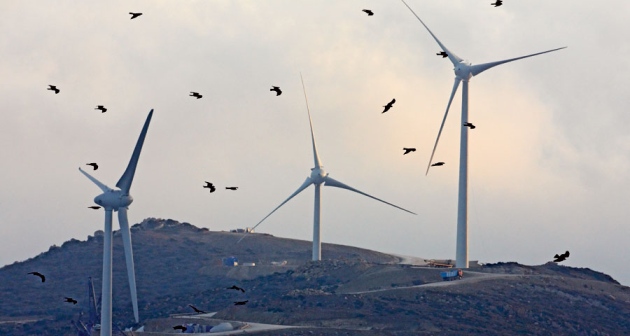
Fracking is only a problem insofar as it is an imperfect solution to a larger issue. That larger issue is how to generate energy without further increasing our contribution to climate change. This desire for cleaner fuel sources has made natural gas more attractive, and the increased demand has been met by wider use of fracking. The demand is so great that 91 to 273 additional wells have to be drilled every year just to maintain current production of natural gas (Stephenson et al., 2011, p. 10760). The economic and environmental benefits provided by fracking have been the driving force behind the increased popularity of fracking.

Fracking provides many two main economic benefits: creating jobs and economically producing natural gas. From 2007 to 2012, employment in the U.S. private sector grew by a measly 1%, while the oil and natural gas sector grew by a whopping 40% (U.S. EIA, 2013). This amounted to a total of 725,000 jobs nationwide, cutting unemployment by half a percent during the recession (Reuters, 2015). Most of these jobs were created near where the gas was extracted, at a rate of roughly 2.5 jobs per million dollars of gas extracted (Reuters, 2015). The majority of these jobs were within 100 miles of new natural gas production, with some directly involved in producing the gas, and some indirectly assisting (Reuters, 2015, U.S. EIA, 2013). Jobs for drilling wells increased only marginally, with most of the overall increase being in the areas of extraction and support (U.S. EIA, 2013). As shown by the data, fracking has a significant impact on employment, making it a promising source of energy.

The increased production of natural gas caused by fracking has had many positive economic effects. One of the most stunning effects is that the U.S. now produces 97% of its natural gas needs (U.S. EIA, 2017). This has resulted in net imports of natural gas declining by roughly 3 trillion cubic feet from 2005 to 2016 (U.S. EIA, 2017). In fact, the U.S. is expected to export as much as 7 trillion cubic feet of natural gas per year by 2025 (Sieminski, 2014). For now, the natural gas produced by the U.S. is used domestically, mostly for power generation and in the industrial sector (Sieminski, 2014). This is particularly visible in the Northeastern United States, where electricity generation from natural gas has increased by more than 10 million kWh in Pennsylvania, New York, and New Jersey (U.S. EIA, 2017). With domestic natural gas prices in 2017 being almost universally lower than they were in 2011 (U.S. EIA, 2017), it’s only logical that bulk users of fuel like power plants would switch to take advantage of the sudden windfall. While normally the decrease in operating costs for power plants caused by fracking would be solely of benefit to the economy, this also benefits the environment.

Prices of natural gas in the U.S. are heavily dependent on how much gas can be extracted from shale formations economically (U.S. EIA, 2012). In 2005, near the start of the fracking boom, natural gas prices began to decline rapidly (U.S. EIA, 2012). This trend continued into 2016, with prices plummeting to half of what they were in 2011 (U.S. EIA, 2012). There can be no doubt that fracking is responsible for the current glut of natural gas, with two locations exemplifying this; The Barnett shale in Texas and the Marcellus shale in the Northeast United States. The trends in these areas are mirrored across the U.S., with natural gas from shale and tight formations making up at least 50% of national natural gas production in 2010 (Sieminski, 2014). In Texas horizontal drilling in the Barnett shale has exploded from less than 400 wells in 2004 to over 10,000 by 2010 (U.S. EIA, 2011). These horizontal wells are responsible for roughly 90% of the natural gas production of the entire Barnett shale, despite only making up 70% of productive wells in the region (U.S. EIA, 2011). In the Northeast U.S. the Marcellus shale has provided so much cheap gas that power plants have increased their use of natural gas by 20%, making natural gas responsible for 41% of power generation in the region by 2016 (U.S. EIA, 2017). This has mostly come at the expense of coal, which in New York and Connecticut has seen a 90% decline from 2006 levels (U.S. EIA, 2017). In addition to the increased availability of natural gas, environmental policies such as tax credits and mandates to reduce CO2 emissions have made natural gas increasingly attractive compared to coal (U.S. EIA, 2017). Despite prices in 2012 being 30% lower than the previous year, the only coal that increased in production was high-sulfur coal that is compatible with CO2 reducing scrubbers (U.S. EIA, 2013). Similarly, in 2012 cheap natural gas was so abundant that carbon dioxide emissions from coal burned for power generation decreased to levels not seen since 1984 (U.S. EIA, 2013). While electricity sales declined by only 1% nationally from 2006 to 2016, total CO2 emissions from energy generation fell by roughly 10% (U.S. EIA, 2013, U.S. EIA, 2017). This is due to the fact that the main component of natural gas is methane (CH4) (Teasdale et al., 2014), and methane releases roughly 50% as much carbon as coal when burned (U.S. EIA, 2017). By replacing carbon intensive coal with cleaner natural gas in the energy sector, less total carbon has been emitted despite overall production remaining roughly the same (U.S. EIA, 2013, U.S. EIA, 2017). In 2015 when emissions from coal and natural gas in the energy sector were nearly equal, natural gas produced 80% more electricity than coal, clearly cementing natural gas as the less carbon intense fuel (U.S. EIA, 2017). By providing more energy at a similar or even lesser cost to coal, natural gas is paving the way for an energy-secure future with less carbon emissions.

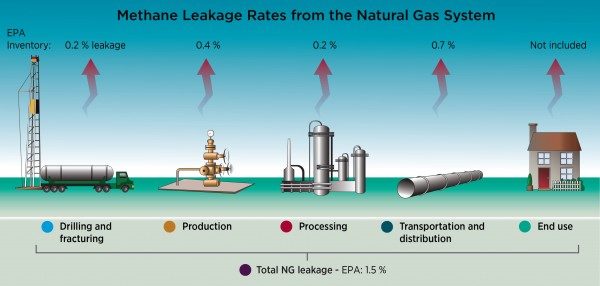
While natural gas has been shown to cause less carbon dioxide emissions than the coal it is replacing, it brings with it a new problem, that of methane leakage.  Methane emissions are a concern because methane is a particularly potent greenhouse gas.  Greenhouse gases are gases that trap heat in the atmosphere, contributing to climate change. The overall impact each gas has on global climate change depends on the the amount of time it stays in the atmosphere, overall quantity of it in the atmosphere, and how strongly it absorbs energy (EPA, 2017). Using these factors, greenhouse gases are compared using a unit of measurement known as the Global Warming Potential (GWP) (Forster, 2007., p. 210). GWP is standardized to be comparative to carbon dioxide, so a gas with a GWP of 2 has twice the effects of an identical amount of carbon dioxide when released into the atmosphere (Forster, 2007., p. 210). The GWP of methane is 72 for a period of 20 years, and 21-25 for a period of 100 years (Forster, 2007., p. 212), so we can see it has a much larger impact on trapping heat than carbon dioxide. While methane only has a lifetime of 12 years, the indirect effects it can have on other compounds allow it to do damage long after its initial release (Forster, 2007., p. 212). With natural gas and petroleum systems making up the largest energy-related methane emissions source in the U.S., something needs to be done to control their emissions (EPA, 2017).  

For overall emissions coming from fracking, Allen et al. (2013) found that natural gas production emits about 2.3×10¹² grams of methane, which comprises of 0.42% of gross gas production (Allen et al., 2013, p. 17772).  Of the total emissions, Omara et al. (2016) compared methane emission rates from conventional (vertical drilling for reservoirs that have high permeability) and unconventional (horizontal drilling for low-permeability sources, such as shale) natural gas extraction wells.  The authors found that unconventional wells (850 to 9.29×10⁴ g/h) generally emitted higher amounts of CH4 than conventional wells (20 to 4480 kg/h) (Omara et al., 2016, 2102).  Considering natural gas’s comparatively massive GWP, total leakage from fracking systems must be less than 3.2% to have net environmental benefits over coal, a notoriously dirty fuel (Alvarez et al., 2012, p. 6437). Consensus in scientific literature shows that fracking in the United States has leakage rates between 3% and 17%, meaning we have likely already passed the point where natural gas provides benefits (Caulton et al., 2015, pg. 6240, Jiang et al., 2011, p. 7, Karion et al., 2013, p. 4396).  Coupling the rise in demand of fracking with the rapid decrease of well productivity after the first year (Stephenson et al., 2011, p. 10760), new wells are constantly needing to be drilled.  This means methane emissions from fracking will continue to increase, and we will continue to stray further from the environmental benefits fracking was originally thought to have if nothing is done about these emissions (Schneising et al., 2014).

Fracking can be broken into four phases: pre-production, drilling, fracturing, and well completion (Jiang et al., 2011).  Of all the stages, well completion has the greatest methane emissions.  During this process, methane can be emitted through flowback, the recovery of the liquids, if it is not sent to emission control devices (Allen et al., 2013, p. 17769).  Allen et al. (2013) measured a range of about 1.0×10⁴ grams to 1.7×10⁷ grams in methane emissions, with a mean of 1.7×10⁶ grams.  Emissions this high should be addressed.

Further compounding the problem is the fact that inventory estimates of methane leaks are almost universally undervalued (Goetz et al., 2015, Caulton et al. 2015). This is partially due to the difficulty of locating the sources of these leaks (Teasdale et al., 2014). Having official estimates of leakage rates chronically lower than actual rates presents a false picture to the public, making continued fracking seem more viable than it may actually be. More than with almost any other energy source, accurately measuring leak rates and continuously working to reduce them is a critical part of making fracking an economically and environmentally viable energy source. Because of these higher emissions, many environmentalists believe fracking should be gotten rid of altogether.  However, as mentioned previously, when fracking is done right with technology controlling its methane emissions, it has the potential to be a more environmentally friendly source of energy than coal by emitting less carbon dioxide (U.S. EIA, 2013, U.S. EIA, 2017).  This, and the fact that it provides jobs (Reuters, 2015, U.S. EIA, 2013) and lowers the cost of natural gas (U.S. EIA, 2012) is enough reason as to why we should not disregard fracking.

There needs to be solution to fracking’s methane emissions, so that it can meet its potential as an energy source.  Allen et al. (2013) measured methane emissions significantly lower than the EPA’s measurements from the national emissions inventory because 67% of the wells that were in the study sent methane to control devices rather than releasing it to the atmosphere, which brought their emissions significantly down (p. 17770).  One of the most efficient methods to stop the problem of methane leakage from a fracking site is the vapor recovery unit, better known as VRU. VRUs work with the storage tanks, which store emissions from flowback, on a franking site. Storage tanks on fracking sites without VRUs vent approximately 21 billion cubic feet of gas per year (Harvey, 2012). The storage tanks are used to store the natural gas that has been collected throughout the fracking process. VRUs work to remove methane vapors that build up in the tank. Without VRUs methane can be get lost in the atmosphere when the gas is added to the tank, and when the gas is being removed from the tank (Harvey, 2012). The VRU system works by analyzing the pressure in the tank and when it reaches a set point the gas goes through a gas vent line and into the VRU machine .Within the VRU machine the gas is filtered through a scrubber where the liquid trapped is returned to the liquid pipeline system or to the tanks, and the methane recovered is pumped into gas lines (Changnet, 2008).

VRUs may be the answer to the methane leakage problem, as they can capture up to 95% of methane that would have leaked into the atmosphere from the storage tanks of a fracking site that does not use one (Harvey, 2012). The gas company Encana has a site in Wyoming that installed a VRU in order to reduce methane emissions. The VRU machine has shown to reduce 80% emissions in the past four years (Sider, 2014).

Using this machine will not only reduce most of the methane released, it could also save gas companies thousands of dollars in the long run. The methane gas that is filtered into the VRU can potentially be harvested and used for profit.  Anadarko Petroleum Corporation reported that at peak capacity their VRU were able to capture 25 million cubic feet of gas per day. At this rate the company was able to make $18,262 off the VRU alone in one year (Harvey, 2012). Gas companies that are using VRU systems have reported that they have been extremely beneficial when it comes to the payback. The gas producing company ConocoPhilips had installed a VRU system onto 9 tank batteries on one of their sites. This in total cost the company $712,500, however it did not take long for that money to be worth the investment. In just four months the VRU were able to bring the company enough profit to refund this payment. After that every month the VRU brought the company $189,000 (Harvey, 2012).

In 1970, Congress passed the Clean Air Act of 1970, which mandates reductions in various harmful volatile organic compounds (VOC). The act covers many aspects of VOC emissions, but fracking sites continue to emit methane which is harmful to the environment. This brings us to our proposal. If the EPA implemented stricter regulations on methane emissions in the Clean Air Act, companies would be forced to adopt various technologies, VRUs being one of them, in order to meet EPA regulations. In turn, the nation could stay away from relying on coal while minimizing harm to the environment from fracking. Methane emissions from fracking are indeed an issue, and something needs to be done to reduce them.

Certain drilling sites in Montana, Colorado, and Utah have already adopted this technology (EPA, 2014). This is the result of competition between fracking companies who aim to make their sites less harmful to air quality (Biello, 2010). In fact, mandatory Stage I and Stage II vapor recovery systems are a direct result of the Clean Air Act. These systems can be found at gasoline dispensing facilities (GDF), known to all of us simply as the gas stations that dot various roadways. Whenever gasoline is transported or pumped from one container to another, VOCs naturally escape into the atmosphere. Since GDFs can be found in many locations, harmful amounts of VOCs can be emitted into the atmosphere due to the frequency of oil tankers delivering fuel to GDFs and consumers refueling their automobiles. Stage I vapor recovery systems refer to when oil tankers deliver gasoline to various GDFs, and Stage II refers to when consumers refuel their automobiles. When consumers refuel their automobiles at GDFs, VOCs that would normally escape into the atmosphere are returned to the underground gas reservoirs at these GDFs. When oil tankers refill these reservoirs, the trapped VOCs are returned to the oil tankers (PEI, 2017). These regulations have invariably had an incredible impact on VOC emissions in the following years. The EPA shows that since 1970, VOC emissions have dropped from approximately 12 grams per vehicle mile travelled, to 2 (EPA, 2017). This shows that on a federal level, technology can be successfully and widely adopted in order to improve air quality at the expense of energy companies. If it can be done for petroleum, why can’t it be done for natural gas?

In order to reduce humanity’s impact on climate change, we should take the necessary steps to reduce GHG emissions.  While hydraulic fracturing is not the largest source of methane emissions, any chance to reduce emissions should be taken advantage of. There are a wide variety of ways one could reduce emissions from fracking, but not all of them are realistic. Flaring is already a common practice in the industry, but why burn off a useful gas when you can harness its potential? When a solution such as VRUs is readily available, why not utilize it?  They have a high efficiency of reducing emissions, and provide an opportunity for companies to profit from the captured methane.  We see VRUs already being implemented at certain sites across the country, and government-mandated implementation of vapor recovery technology is already present in gas stations, so it seems reasonable to do the same for fracking sites. And with the ever growing need for energy in our industry-driven world, and a steadily decreasing amount of natural gas, shouldn’t we harness all that we can, and protect our world while we’re at it?

AUTHORS

Hillary Wilcox – Animal Science Major

Mikhaela Flynn- Environmental Science Major

Sean Mulvaney – Natural Resource Conservation Major

Winsten Chen- Natural Resource Conservation Major


REFERENCES

Allen, D. T., Torres, V. M., Thomas, J., Sullivan, D. W., Harrison, M., Hendler, A., … Seinfeld, J. H. (2013). Measurements of methane emissions at natural gas production sites in the united states. Proceedings of the National Academy of Sciences of the United States of America, 110(44), 17768-17773. doi:10.1073/pnas.1304880110

Alvarez, R. A., Pacala, S. W., Winebrake, J. J., Chameides, W. L., & Hamburg, S. P. (2012).

Greater focus needed on methane leakage from natural gas infrastructure. Proceedings of

the National Academy of Sciences, 109(17), 6435-6440.

Biello, D. (2010, March 30). What the Frack? Natural Gas from Subterranean Shale Promises U.S. Energy Independence–With Environmental Costs. Retrieved December 3, 2017, from https://www.scientificamerican.com/article/shale-gas-and-hydraulic-fracturing/

Caulton, D. R., Shepson, P. B., Santoro, R. L., Sparks, J. P., Howarth, R. W., Ingraffea, A. R.,

… Miller, B. R. (2014). Toward a better understanding and quantification of methane

emissions from shale gas development. Proceedings of the National Academy of

Sciences, 111(17), 6237-6242. www.pnas.org/cgi/doi/10.1073/pnas.1316546111

[Changet]. (2008, August 2008). Vapor recovery unit principles – sample [Video File] Retrieved from https://www.youtube.com/watch?v=tLBBQtu4l3E

Forster, P., Ramaswamy, V., Artaxo, P., Berntsen, T., Betts, R., Fahey, D. W., … Van Dorland, R. 2007: Changes in Atmospheric Constituents and in Radiative Forcing. In: Climate Change 2007: The Physical Science Basis. Contribution of Working Group I to the Fourth Assessment Report of the Intergovernmental Panel on Climate Change [Solomon, S., D. Qin, M. Manning, Z. Chen, M. Marquis, K.B. Averyt, M.Tignor and H.L. Miller (eds.)]. Cambridge University Press, Cambridge, United Kingdom and New York, NY, USA.

Goetz, J. D., Floerchinger, C., Fortner, E. C., Wormhoudt, J., Massoli, P., Knighton, W. B., et al. (2015). Atmospheric emission characterization of marcellus shale natural gas development sites. Environmental Science & Technology, 49(11), 7012. Retrieved from MEDLINE database. Retrieved from http://www-ncbi-nlm-nih-gov.silk.library.umass.edu/pubmed/25897974

Harvey, S. (2012, March). Leaking profits the US oil and gas industry can reduce, pollution, conserve water, and make money by preventing methane waste, Retrieved November 13, 2017 from https://www.nrdc.org/sites/default/files/Leaking-Profits-Report.pdf

Hurdle, J. (2010, April 05). Natural gas boom brings riches to a rural town. Retrieved December 02, 2017, from https://www.reuters.com/article/us-energy-fracking-wellsboro/natural-gas-boom-brings-riches-to-a-rural-town-idUSTRE6341Y420100405

Jiang, M., Griffin, W. M., Hendrickson, C., Jaramillo, P., VanBriesen, J., & Venkatesh, A. (2011). Life cycle greenhouse gas emissions of Marcellus shale gas. Environmental Research Letters, 6(3), 1-9. doi:10.1088/1748-9326/6/3/034014

Karion, A., Sweeney, C., Pétron, G., Frost, G., Michael Hardesty, R., Kofler, J., … Brewer, A. (2013). Methane emissions estimate from airborne measurements over a western United States natural gas field. Geophysical Research Letters, 40(16), 4393-4397. doi: 10.1002/grl.50811

Omara, M., Sullivan, M. R., Xiang, L., Subramanian, R., Robinson, A. L., & Presto, A. A. (2016). Methane Emissions from Conventional and Unconventional Natural Gas Production Sites in the Marcellus Shale Basin. Environmental Science & Technology, 50(4), 2099-2107. doi:10.1021/acs.est.5b05503

PEI. (2017). Stage II Vapor Recovery. Retrieved December 3, 2017, from https://www.pei.org/wiki/stage-ii-vapor-recovery

Purdue University (2004). Petroleum and Coal. Retrieved November 18, 2017, from

http://chemed.chem.purdue.edu/genchem/topicreview/bp/1organic/coal.html

Reuters. (2015, November 06). U.S. fracking boom added 725,000 jobs -study. Retrieved December 02, 2017, from https://www.reuters.com/article/usa-fracking-employment-study/u-s-fracking-boom-added-725000-jobs-study-idUSL8N13159X20151106

Schneising, O., Burrows, J. P., Dickerson, R. R., Buchwitz, M., Reuter, M., & Bovensmann, H.

(2014). Remote sensing of fugitive methane emissions from oil and gas production in

north american tight geologic formations. Earth’s Future, 2(10), 548-558.

doi:10.1002/2014EF000265

Sider, A. (2014, May 18). Energy Companies Try New Methods to Address Fracking Complaints. Retrieved December 01, 2017.

Sieminski, A. (2014, October 17). Https://www.eia.gov/pressroom/presentations/sieminski_10172014.pdf [PDF]. Chicago: U.S. EIA.

Stephenson, T., Valle, J. E., & Riera-Palou, X. (2011). Modeling the relative GHG emissions of conventional and shale gas production. Environmental science & technology, 45(24), 10757-10764.

Teasdale, C. J., Hall, J. A., Martin, J. P., & Manning, D. A. C. (2014). Ground

gas monitoring: implications for hydraulic fracturing and CO2 storage. ACS Publications,

48, 13610?13616. dx.doi.org/10.1021/es502528c

U.S. EIA. (2011, July 12). Technology drives natural gas production growth from shale gas formations. Retrieved December 03, 2017, from https://www.eia.gov/todayinenergy/detail.php?id=2170


U.S. EIA. (2012, August 27). Projected natural gas prices depend on shale gas resource economics. Retrieved December 03, 2017, from https://www.eia.gov/todayinenergy/detail.php?id=7710

U.S. EIA. (2013, April 5). Energy-related carbon dioxide emissions declined in 2012. Retrieved

November 20, 2017, from https://www.eia.gov/todayinenergy/detail.php?id=10691

U.S. EIA. (2013, August 8). Oil and gas industry employment growing much faster than total private sector employment. Retrieved December 02, 2017, from https://www.eia.gov/todayinenergy/detail.php?id=12451

U.S. EIA. (2013, January 14). 2012 Brief: Coal prices and production in most basins down in 2012. Retrieved December 03, 2017, from https://www.eia.gov/todayinenergy/detail.php?id=9570

U.S. EIA. (2017, June 8). Frequently Asked Questions – How much carbon dioxide is produced

when different fuels are burned? Retrieved November 20, 2017, from

https://www.eia.gov/tools/faqs/faq.php?id=73&t=11

U.S. EIA. (2017, November 13). CO2 emissions from coal fell by record amount in 2015, led by Texas and Midwest. Retrieved December 03, 2017, from https://www.eia.gov/todayinenergy/detail.php?id=33712

U.S. EIA . (2017, May 11). Natural gas has displaced coal in the Northeast’s generation mix over the past 10 years. Retrieved November 20, 2017, from https://www.eia.gov/todayinenergy/detail.php?id=31172

U.S. EIA. (2017, October 25). Where Our Natural Gas Comes From. Retrieved December 02, 2017, from https://www.eia.gov/energyexplained/index.cfm?page=natural_gas_where


U.S. EIA. (2017, October 31). Natural Gas Prices. Retrieved November 20, 2017, from

https://www.eia.gov/dnav/ng/ng_pri_sum_a_EPG0_PEU_DMcf_a.htm

U.S. EPA. (2014). Use of Vapor Recovery Towers and VRU’s to Reduce Emissions. Retrieved December 3, 2017, from https://www.epa.gov/sites/production/files/2016-04/documents/vapor_recovery_units.pdf

U.S. EPA. (2017, April 14). Overview of Greenhouse Gases. Retrieved

from https://www.epa.gov/ghgemissions/overview-greenhouse-gases

U.S. EPA. (2017, January 09). The Process of Hydraulic Fracturing. Retrieved December 02, 2017, from https://www.epa.gov/hydraulicfracturing/process-hydraulic-fracturing

U.S. EPA. (2017). Progress Cleaning the Air and Improving People’s Health. Retrieved December 3, 2017, from https://www.epa.gov/clean-air-act-overview/progress-cleaning-air-and-improving-peoples-health
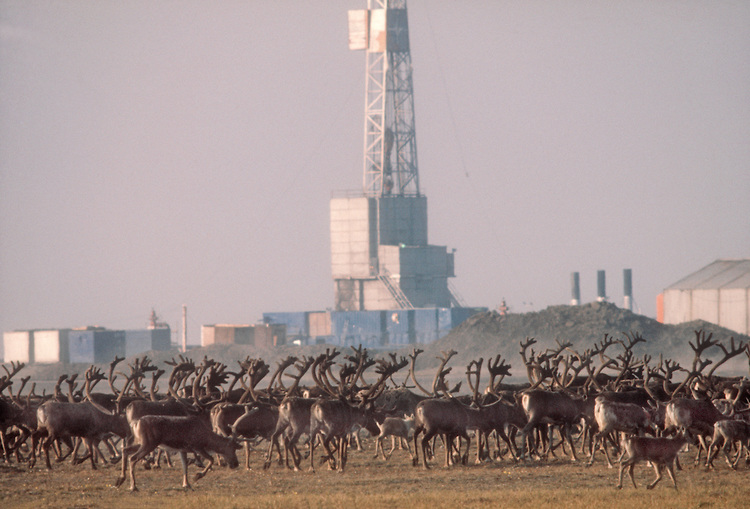
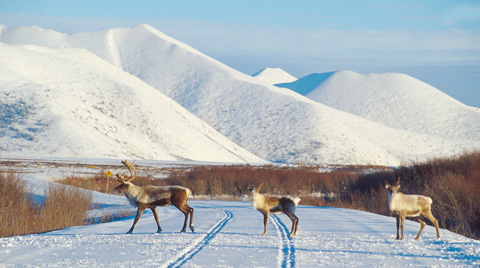


Dealing with Coal Mining Effects

In an area of lush green wildlife and rolling mountains, disaster plagues the lives of many who live in the Adirondack area. Not only does mountaintop removal destroy the beautiful landscape that many residents treasure, but it leaves these people with alarming conditions everyday. Maria Gunnoe of Bobwhite, West Virginia, raised by a coal mining family and left land to raise her own family on, lives in constant fear of a disaster waiting to happen. Due to a mountaintop removal project launched in 2000, Maria’s property flooded 7 times in 3 years, even washing away the access bridge to her street and the family’s dog. Because of the threatening conditions, Maria has stated that her children go to sleep prepared to be ready at a moment’s notice to leave their house whenever heavy rain ensues. Now living in a community wrecked by land degradation and poverty, Maria cannot afford nor find anyone to buy her property and cannot provide her family with simple resources, such as clean water (Palone, 2013). Rather than fleeing and giving her community over to the coal companies, Maria is a leader in the movement to end mountaintop removal and organizes to strengthen legislation that is supposed to protect her rights. “This is absolutely against everything that America stands for. And I know that we have better options than this. We do not have to blow up our mountains and poison our water to create energy. I will be here to fight for our rights. My family is here, we’ve been here for the past 10 generations, and we’re not leaving. We will continue to demand better for our children’s future in all that we do” (Mountain Heroes: Maria Gunnoe, 2012, p. 1).

Continue Reading

The Effects of Offshore Oil Drilling in the Arctic on Marine Ecosystems and Wildlife

Kalynn Kennedy – Sustainable Horticulture

Keegan Burke – Natural Resources Conservation

Gabrielle Green – Pre-Veterinary Science

Annie Le – Pre-Veterinary Science

Fish products and crude oil exportation are multibillion dollar industries in the United States. Within the month of August of this year, the United States generated approximately 657 thousand barrels of crude oil on a given day (US Energy Information Administration, 2016, figure 2). While drilling is highly important in creating exportation revenue and domestic supply, it also harms marine ecosystems through means of biodegradation, the breakdown of material in the environment. The fate of marine wildlife, the animals and plants that rely on the sea for their survival, is at the hands of oil-drilling companies. Continue Reading

Comprehensive Assessment of Wind Turbine Effects on At-Risk Bird Populations

Derek Power – Building Construction Technology

Lily Coughlin – Animal Science

Josh Cardin – Planet Soil & Insect Sciences

Wind power is one of the fastest growing branches of the energy industry and is a crucial part of our world’s plan for renewable energy. Wind farms are an incredibly sustainable and clean fuel source. Wind energy does not pollute the air like power plants that rely on combustion of fossil fuels, such as coal or natural gas. Wind energy is also categorized as a form of solar energy so as long as the sun keeps shining and the wind keeps blowing, the energy produced can be harnessed to send power across the grid. In addition to being sustainable and clean, wind farms benefit the economy as well. The cost of generating wind energy is similar to that of fossil fuels (Fehrenbacher, 2015). The industry also creates jobs, and in many cases the farms can be built on existing ranches or farms (“Advantages and Challenges,” 2013). According to the Wind Vision Report, wind has the potential to support more than 600,000 jobs in manufacturing, installation, maintenance, and supporting services by 2050 (“Advantages and Challenges,” 2013). Continue Reading

Reducing Wind Energy-Related Mortality in Threatened Raptors

Wind turbines pose a greater threat to threatened species, like the California condor.

Wind turbines pose a greater risk to threatened species, like the California condor.

Sheridan Devlin- Environmental Science

Rebecca Haber- Pre-Veterinary Science

12/06/2016

Rehabilitators took California condors into custody in order to secure their population in the 1980s (Avants, 2016). Recently they released Condor AC-4, a male in the California Condor Recovery Program, back into the wilderness. AC-4 fathered the first captive-born chick and through controlled breeding in captivity, the number of California condors rose from 22 to 435 (Avants, 2016). After spending 30 years in the San Diego Zoo Safari Park, rehabilitators finally gave him a clean bill of health and decided he was fit to return to the wilderness again after blood levels indicated low lead content (USFWS, 2016). AC-4 serves as a reminder that the California condor’s population is still slowly recovering. This threatened species still requires protection, and wind energy–lauded for its environmental benefits–could ironically and unintentionally lead to their extinction (Platt, 2013). Continue Reading