Fish farms won’t let native populations off the hook


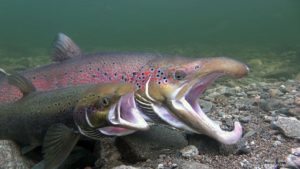
Atlantic Salmon in Kuterra’s on-land fish farm

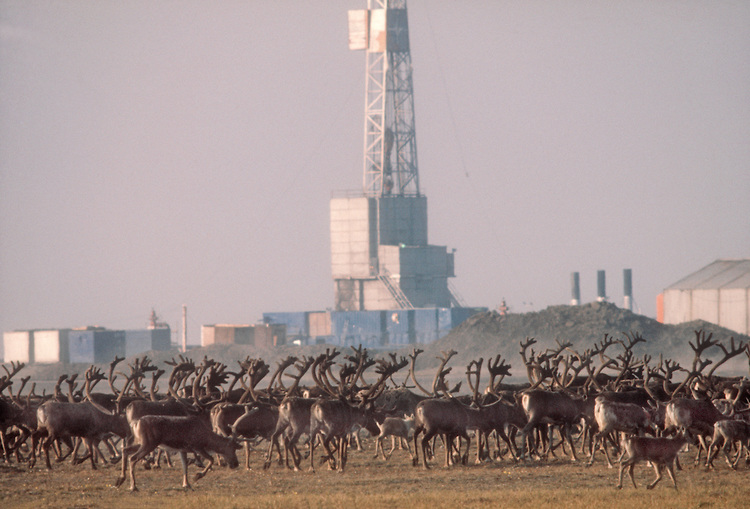
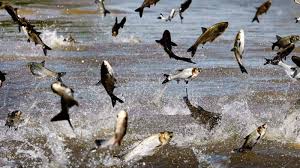
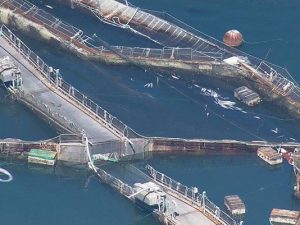
In late August 2017, a fish farm owned by Cooke Aquaculture allowed more than 300,000 non-native Atlantic salmon escape into the Puget Sound of the Pacific Ocean off the coast of Washington state. Several days passed before a salvage team was hired. The main goal of the salvage team is to create a rapid-response center and encourage recreational fishers to catch as many salmon as possible. Earlier that year, Cooke submitted an application for “replacement and reorientation” of the facility to replace or repair the old-fashion steel cages the previous company had used prior to Cooke buying them out in 2016. The application stated that the system was “nearing the end of serviceable life,” and that repairs were needed in September, after the August salmon harvest (Kim E.T., 2017, para.5). A month before the collapse, Cooke had to complete an emergency repair to stabilize the crumbling facility. The emergency repair was to add extra anchors to the site because old ones had come loose and the site drifted away. Despite these concerns, state and federal agencies were not overly worried and figured the farm would remain stable until September and therefore did not ask them to replace the farm ahead of schedule (Kim E.T., 2017). After the escape incident in August, only about 146,000 of the 300,0000 escaped fish were recaptured (Kim E.T., 2017, para.1). Therefore, more than half of the escaped Atlantic salmon were released into the Pacific Ocean. Typically, Atlantic salmon are known to be more aggressive than Pacific salmon and some of the escaped salmon swam upstream towards spawning areas (Alaska Department of Fish and Game [ADFG], 2017; Kim E.T., 2017). Farmed Atlantic salmon can be identified through a mark left on their ear bone by Cooke aquaculture, and have been identified as far north as Fraser River in British Columbia (Mapes, 2017). Even after losing over 300,000 Atlantic salmon in August, Cooke aquaculture at Puget Sound was granted a permit in October to have one million more Atlantic salmon added to their farm. The only requirement for this permit was that the fish moving from the hatchery to the outside pens carry no disease. Their operation was granted the permit even though their prior escape is still under investigation (Mapes, 2017). Cooke’s main argument for the permit was that they had hatched salmon in their hatcheries and it was biologically time for them to move into the water. This is understandable due to rising demand of fish for consumption over the past few years.


In fact, the seafood industry has grown so much that industrial fishing can no longer support the demands of consumers resulting in the overfishing of oceans (Food and Agriculture Organization [FAO], 2011;World Wildlife Fund [WWF], 2017). Overfishing occurs when so many fish are being captured from the ocean that the species cannot reproductively keep up (WWF, 2017). In 2012, about 21% of fish stocks were considered overfished (National Oceanic and Atmospheric Administration [NOAA] Fisheries, 2013, Table 1).

Just like farms on land that produce cows, chickens and pigs for consumption, fish farms are continuing to pop up in our local waters and are solving the problem of overfishing native populations. Aquaculture, the operation of raising fish commercially, supplies more than 50% of seafood produced for consumption, a number that will continue to rise (NOAA Fisheries, 2017-a, para.7). A report from NOAA fisheries illustrated that in 2015, the fish industry generated $208 billion dollars in sales and supported 1.6 million jobs across the United States (NOAA Fisheries, 2017-b, para. 6). In 2016, fish farms aided in bringing the previous 21% of overfished stocks down to 16% (NOAA Fisheries 2016, Table 2). By farming species that were once overfished, aquaculture facilities allow endangered populations to regenerate themselves (NOAA Fisheries, 2016). While the farmed fish industry continues to grow and reduces overfishing, it consequently poses significant risk to surrounding ecosystems when farmed fish escape and introduce parasites, compete for resources, and interbreed with native species. Between 1996 and 2012 close to 26 million fish were released from aquaculture facilities worldwide, that’s an average of about 1.5 million per year, and that’s just reported escapes (Center for Food Safety [CFS], 2012, Table 1). Fish escapes are common all around the world. For example, in Scotland, The Scottish Salmon Company reported that 300,000 Atlantic salmon escaped on May 21, 2017 (Scotland’s Aquaculture, 2017, pg. 2). The escape was said to be caused by the weather. Similarly, another Scottish company, Scottish Sea Farms ltd., reported that a predator caused 17,398 Atlantic salmon to escape from their farm on March 25, 2017 (Scotland’s Aquaculture, 2017, pg. 1). Furthermore, in 2010, 138,000 salmon escaped from pens in Grand Manan Canada from Admiral Fish Farm ltd. (Canadian Press, 2011, para. 2). President of the company, Glen Brown said that the breach was due to storms that prevented repair for more than four days (Canadian Press, 2011, para. 4). This escape could have been prevented if the regulations in place were upheld and state and national officials mandated the pens were fixed prior to the escape. The regulations in place currently are insufficient, and should be revised to prevent bigger and more detrimental escapes from occurring in the future. So, how can we continue to produce farmed fish while limiting the harmful effects of escape on the ecosystem? By improving legislative requirements on fish farms and increasing the number of on-land aquaculture facilities, the ecosystem will be better protected from escaped fish and the parasites, competition, and gene transmission they produce.

When the spawn of wild salmon hatch, they leave the spawning area and do not return until maturity is reached at around two years of age (Martyal, 2010). In the Broughton Archipelago of Western Canada, from 2001 to 2002, the population of expected spawn to return to the spawning area declined by 97% (Martyal, 2010, para. 2). When the population was examined, 90% of the juvenile wild salmon had contracted sea lice (Martyal, 2010, para. 2). 

Sea lice are parasites that feed on bodies of fish leaving open wounds that are susceptible to disease (Farmed and Dangerous, n.d.). Farmed fish are prone to getting sea lice due to being held in crowded cages, which is an ideal breeding area for lice. Juvenile salmon are most susceptible to getting sea lice since their scales have not fully developed, therefore it is easier for the lice to attach and eat away at their flesh (Farmed and Dangerous, n.d). In 2004, all the fish farms in the Broughton Archipelago area were found to have 29.5 million sea lice (Martyal, 2010, para. 6). When wild juveniles come in contact with infected farmed salmon on their two year journey before returning the the spawning area. This is because most fish farms are found in sheltered water areas along wild salmon migration routes (Farmed and Dangerous, n.d.). The juveniles must make it through 50 miles of fish farms before reaching open water (SeaWeb, 2007). Fishery ecologist from the University of Alberta, Martin Krkosek estimates that sea lice kills more than 80% of the salmon expected to return to their spawning sites (SeaWeb, 2007, para. 1). Additionally, Director of the Salmon Coast Field Station, Alexandra Morton addresses that the juvenile salmon from Broughton must be introduced to sea lice through farmed fish because the parents of the juveniles that carry the parasite are too far offshore (SeaWeb, 2007). Morton also confirms the idea that juveniles are too weak to survive sea lice infections (SeaWeb, 2007). Therefore, it is more than likely that the juvenile salmon are contracting sea lice from nearby escaped farmed fish.

One of the more prevalent issues that arises once large amounts of fish escape from aquaculture pens is competition between wild populations and farm-bred populations. Using salmon as a model organism, we can look further into the issues that arise when aquaculture-bred fish begin to interact with ecosystems originally inhabited by natural, wild fish stock.

First and foremost, dietary competition poses a huge threat of starving out endemic populations of salmon once their farm-bred counterparts emigrate to their habitats. Since the domesticated salmon and wild salmon share the same diet, the arrival of additional organisms to an ecosystem gives rise to the threat of surpassing the carrying capacity of said ecosystem and putting both farmed and wild fish at risk of starvation due to resource depletion (Naylor et al., 2005).

This risk is compounded even further by the nature of farm-bred salmon. Since aquaculture farms select for larger, meat-rich fish, farm-bred salmon have selection pressures in their favor (Bajak et al., 2016). Displaying more aggressive behavior, coupled with their larger biomass, farmed salmon are able to exhibit more fitness in acquiring food than their wild cousins, threatening the natural balance of a fragile ecosystem and causing complete ecological collapse (Naylor et al., 2005; Glover et al., 2016). With roughly 40% of salmon caught off the coast of the Faroe Islands being of farmed origin, the true implications of this new-found competition are only beginning to unfold (Naylor et al., 2005, pg. 427).

Not only do farmed salmon pose a risk of starving out wild salmonids, but they also display invasive behaviors in regards to nesting and foraging grounds, displacing native fish stock to more predated waters, potentially with very little resources (Toledo-Guedes et al., 2014).  A study by Van Zwol and associates found data showing that the David’s score (a metric of ecological dominance determined by behavioral analysis) of native salmon dropped when invasive species were introduced to their habitat. This directly resulted in reduced food consumption in the native stock by 40% (Van Zwol et al., 2012, fig. 1). The rise of feral populations of farmed salmonids and the subsequent competition between them and wild stock is a growing concern among ocean ecologists, and is directly tied to decreases in wild salmon population by as much as 50% in recent years (Naylor et al., 2005; Castle, 2017, para. 5).

Similarly, farmed fish can introduce new genes to a native population. When escaped fish mate with their native cousins, populations overtime start to show genetic similarities. Nearly half of the wild salmon population in Norway share about 40% of the gene pool of nearby farmed salmon , showing that the blurring of lines between these two distinct populations is already beginning to unfold (Bajak et al., 2016, para. 3). This may seem harmless, but these traits that are being passed from farmed to wild salmon are not desirable in an open ocean setting. Typically, farmed salmon have a lower fitness and survival rate than wild salmon because they are so used to having their survival needs provided for them by farmers. In this area of weak natural selection, and breeding efforts focused solely on production purposes, domesticated salmon with genetically inherited aggressive behavior put them at increased risk of predation. The same traits that allow farm bred salmon to dietarily out compete wild stock puts them in more danger of being killed by predators (Roberge et al., 2008). When traits are passed on to the hybrid population, they are not as successful as their wild parent and have a greater potential of death. According to the Norwegian Institute of Nature Research and the United Nations Food and Agriculture Organization, by interbreeding native and farmed fish species over two generations there is a significant decline in success, fitness and overall population size (Bajak et al., 2016). A study conducted by Roberge and colleagues, confirms these findings . Roberge compared the level of gene transcription within the genomes of wild and second generation hybrids of wild and farmed salmon. It was found that over 6% of genes had significantly different transcription levels than the first generation cross between the native and farmed population (Roberge et al., 2008, pg. 314). If detrimental genes are propelled into expression by this shock to the genetic system of wild salmon, or if normally functioning genes are overexpressed, the overall fitness of the wild population could exponentially decline. Dr. Christian Roberge, an expert researcher in the field of the effects of salmon hybridization at Laval University claims that this is a serious cause for concern in coming years, as it can lead to population collapse when combined with the other issues highlighted in this paper (Roberge et al., 2008).

Further compounding the damaging effects of interbreeding, the triploidy of hybrid salmon has the potential to majorly contribute to population collapse. Much like mules, horse-donkey hybrids, hybrid salmon possess three sets of chromosomes in comparison to a regular organism’s two, rendering them incapable of reproduction (Fjelldall et al., 2014). Therefore, if a large amount of triploid hybrid salmon are present in a population, mass die offs and subsequent population decreases are inevitable, as the population has no means of sustaining itself if it cannot reproduce at a rate faster than it dies off.

By gene transmission between wild and farmed populations, and the proliferation of triploidy, the overall survival rate for fish in wild ocean environments are declining and causing a deleterious effect on the ecosystem. A successful ecosystem needs high survival rates for it organisms by ensuring specific health needs are met. As Dr. Roberge highlighted in his analysis of the genetic transcription differences between native and farmed salmon, these issues will only compound with time, and can quickly get out of control if we do not do anything to rectify them.

Aquaculture is a complicated system that falls under the jurisdiction of the Environmental Protection Agency along with several other state and federal agencies in the United States (Centers for Epidemiology & Animal Health, 1995). The EPA sets effluent limitation guidelines (ELGs), which restrict the allowable amount of pollution that large Concentrated Animal Production Facilities (CAAP) can produce (Harvard Law School et al., 2012). By the Clean Water Act (CWA) definition, any CAAP that has a “discernible, confined and discrete conveyance… from which pollutants are or may be discharged” is termed a point source polluter (Harvard Law School et al., 2012). The CWA is regulated under the EPA (Harvard Law School et al., 2012).Through the EPA aquaculture facilities are regulated as point source polluters if they produce more than 20,000 (cold water facilities) or 100,000 (warm water facilities) pounds of fish per year and use 5,000 pounds or more of feed per month for at least 30 days per year (Harvard Law School et al., 2012). However, ELGs do not apply to CAAPs that do not fall below these requirements and are instead governed by the National Pollutant Discharge Elimination System (NPDES) (Harvard Law School et al., 2012). Under the NPDES these facilities are required to obtain a permit with specific effluent limitations based off the judgement of the individual writing the permit (Harvard Law School et al., 2012). Therefore, there are no strict guidelines, just the permit writer’s assessment. ELGs can have both numeric and narrative limitations but do not require one or the other (Harvard Law School et al., 2012). While for larger CAAPs, ELGs help regulate the limitation of food input necessary for production, the proper storage of drugs and pesticides, and routine inspections, they do not explicitly address fish escape as a problem (Harvard Law School et al., 2012).

While there are massive ecological consequences to fish escape, the most direct and immediate effect felt by people is the economic damage caused by lost fish. Across six European nations (United Kingdom, Norway, Malta, Ireland, Spain and Greece) over a three year period, 8,922,863 fish escaped in 242 incidents, with over five million of those occurring during two catastrophic events. This accounts for a €47.5 million loss per year, or $56,391,050 (Jackson et al., 2015 , pg. 22). This cost alone is incentive for increased regulations, as solving the fish escape problem would mean cheaper fish for consumers and more profits for the farmers.

Many detractors of legislation would claim that it’s impossible to impose legislation into the mix of a low-profitability production environment such as fisheries. Increasing profitability and employment in the industry all while increasing protection to the environment can seem unattainable, but these are exactly the regulatory goals Norway has adopted in regards to its massive fisheries industry. Despite being the 118th largest country by population, Norway is the world’s 10th largest producer of fish (Årland, & Bjørndal, 2002, pg. 309). By instituting annual quotas for total allowable catches for various species, as well as freezing and sometimes even cutting allowable production in at-risk areas for pathogen transmission, Norway has effectively been able to manage stock populations and detriment to the environment effectively (Castle, 2017). Between 2006 and 2010, fish escapes in Norway decreased precipitously from 290,000 to just 70,000, an over 400% decrease (CFS, 2012, Table 1). This is concrete evidence of the feasibility and efficacy of regulations in the aquaculture industry, and legislators would be wise to follow Norway’s highly successful path.

Cooke aquaculture at Puget Sound is currently under investigation because the Wild Fish Conservancy (WFC) has filed a citizen suit against them under the CWA (Schuitemaker, 2017). The CWA monitors the water quality impacts of aquaculture and any pollutants that are released into the water without a permit (Harvard Law School et al., 2012). The WFC maintains that Cooke should be held accountable because living organisms, like fish that are released into the water, are considered pollutants (Harvard Law School et al., 2012). If the set ELGs for large fish farms do not directly include protection against fish escape and continue to group escaped fish as a pollutant, why would individual perimeters for smaller farms consider it?

Regulations by the EPA should be expanded to include all size farms, and should acknowledge escaped fish separately from other pollutants. Additionally, new and existing regulations should be enforced and recorded more consistently to ensure that new aquaculture facilities are not constantly reinventing the wheel, and can obtain knowledge on running an environmentally and economically conscious facilities (Harvard Law School et al., 2012). If facilities are forced to limit the concentration of fish within a pen, less fish will escape into the open water, should an escape occur. If strict enough regulations, punishments and fines are implemented, few farms could skirt the responsibilities involved with running an ecologically sustainable aquaculture facility and maintain economic feasibility (Thorvaldsen et al., 2015).

Facilities should regularly be inspected by their operating company and the EPA to ensure fish pens are secure and can endure regular weather, tide, and ocean variabilities in the area (Fisheries and Oceans Canada, 2017). Increased inspections would limit the amount of equipment becoming dilapidated to prevent future escapes, like the one that occurred at Cooke aquaculture.

Even if no reprimanding action is taken or required of facilities, all incidents of escape should be recorded and investigated to prevent future incidents from occurring and to be used as guidelines for other facilities so they can avoid making the same errors (Fisheries and Oceans Canada, 2017; Harvard Law School et al., 2012; Scotland, 2017). A list of all escape incidences should be created and updated yearly to ensure an accurate number of escapees is gathered (Scotland, 2017; Fisheries and Oceans Canada, 2017).

While instituting new legislation is a viable solution to preventing environmental issues in regards to fish farms, the costs associated with implementing and enforcing regular inspections, water quality tests, and regulating farm sizes and outputs are considerable and discourage new players from entering the aquaculture industry (McCarthy and River, 2002). Stringent enforcement of these regulations is also absolutely necessary, as many companies simply skirt regulations when they lack oversight due to operational complications, lack of operator education, tight schedules and efficiency initiatives (Thorvaldsen et al., 2015).

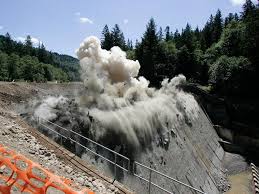
In addition to increasing regulation, creating more on-land fish farm facilities will eliminate escape occurrences, and significantly decrease the environmental impacts fish farms have on open water ecosystems (O’Neill, 2017). When possible, moving fish farms to facilities on land could be the solution to preventing fish escape and the myriad of environmental issues mentioned previously that facilities produce in open water environments (Aukner, 2017). This solution readily applies to the majority of fish species, as moving to on-land facilities is a viable and more sustainable option, but for the majority of shellfish, like clams, oysters, and scallops farming in open water can be more beneficial to the environment than destructive by because these species can remove biotoxins, chemical contaminants, and pathogenic microorganisms during their natural process of filtering water for food and other resources (Connecticut Department of Agriculture, 2017). Kuterra, a land based aquaculture facility has had great success in starting an on-land fish farm, and releases documents containing information on the costs associated with on-land fish farming, guides to operating on-land facilities, and the benefits of farming on-land which are valuable to other companies interested in opening facilities (Kuterra, 2014). With the support of multiple national and international companies, their hope and mission is that more farms will open or move on shore in the future and by providing resources future companies can avoid costly trial and error processes (Kuterra, 2014). Several farmed species are marine fish, and therefore require access to saltwater, so on- land facilities are limited by location, needing to stay within several kilometers from a saltwater source in order to operate (Kuterra, 2014).

In order to create a sustainable and economically productive aquaculture industry going  forward, regulations must be changed to accommodate greater operational aspects of fish farms. This industry could and should be reshaped to prevent further degradation of the environment without sacrificing economic capacity. Additionally, innovations, such as on-land fish farms, must continue to be proposed and investigated for feasibility and efficacy. The future of mankind’s fisheries is at stake, and pivotal action must be taken to ensure the safety of our seafood supplies. We strongly advise following the advice of the wealth of experts cited in this paper, and implement strict regulations in the vein of Norway’s that regulate density of fish in net pens, total annual production limits and scalebacks, and fines for noncompliance.

AUTHORS

Eleah Caseau, Environmental Science

Jenna Costa, Animal Science, Biotechnology Research

Trevor Klock, Plant and Soil Science


REFERENCES

Alaska Department of Fish and Game (2017). Invasive Species — Atlantic Salmon (Salmo salar) Impacts. Retrieved from http://www.adfg.alaska.gov/index.cfm?adfg=invasiveprofiles.atlanticsalmon_impacts

Årland, K., & Bjørndal, T. (2002). Fisheries management in norway—an overview. Marine Policy, 26(4), 307-313. doi://doi.org/10.1016/S0308-597X(02)00013-1

Bajak, A., Simms, E. L., McDowell, C., Graham, W., & Petit, C. (2016). Into the Wild: When Farmed Salmon Interbreed With Their Wild Cousins. Retrieved from https://undark.org/2016/08/12/muddy-waters-happens-farmed-salmon-go-wild/

The Canadian Press. (2011). 138,000 Farmed Salmon Escape into Bay of Fundy. Retrieved from http://www.ctvnews.ca/138-000-farmed-salmon-escape-into-bay-of-fundy-1.593713

Castle, Stephen. (2017). As Wild Salmon Decline, Norway Pressures Its Giant Fish Farms. New York Times. Retrieved from https://www.nytimes.com/2017/11/06/world/europe/salmon-norway-fish-farms.html

Centers for Epidemiology & Animal Health (1995).Overview of aquaculture in the United States. United States Department of Agriculture: Animal and Plant Health Inspection Service. Retrieved from https://www.aphis.usda.gov/animal_health/nahms/aquaculture/downloads/AquacultureOverview95.pdf

Center for Food Safety. (2012). Reported escapes from fish farms. Retrieved from https://www.centerforfoodsafety.org/files/fish-escapes-chart_14767.pdf

Connecticut Department of Agriculture. (2017). Environmental benefits of shellfish aquaculture. Retrieved from http://www.ct.gov/doag/cwp/view.asp?a=1367&q=478090

Farmed and Dangerous. (n.d.). Sea Lice. Retrieved December 04, 2017, from http://www.farmedanddangerous.org/salmon-farming-problems/environmental-impacts/sea-lice/

Fisheries and Oceans Canada. (2017). Escape Prevention. Government of Canada. Retrieved from http://www.dfo-mpo.gc.ca/aquaculture/protect-protege/escape-prevention-evasions-eng.html

Fjelldal, P. G., Wennevik, V., Fleming, I. A., Hansen, T., & Glover, K. A. (2014). Triploid (sterile) farmed atlantic salmon males attempt to spawn with wild females. Aquaculture Environ Interact, 5 doi:10.3354/aei00102

Food and Agriculture Organization of the United States. (2011). Fish Consumption reaches all-time high. Retrieved from http://www.fao.org/news/story/en/item/50260/icode/

Glover. K.A., Bos, J.B., Urdal, K., Madhun, A.S., Sørvik, A.G. E., Unneland, L., … Wennevik, V. (2016). Genetic screening of farmed Atlantic salmon escapees demonstrates that triploid fish display reduced migration to freshwater. Biological Invasions 18. 1287-1294, doi: 10.1007/s10530-016-1066-9.x

Harvard Law School Emmett Environmental Law & Policy Clinic, Environmental Law Institute, & The Ocean Foundation. (2012). Offshore Aquaculture Regulation Under the

Clean Water Act. Retrieved from http://eli-ocean.org/wp-content/blogs.dir/3/files/CWA-aquaculture.pdf

Jackson, D., Drumm, A., McEvoy, S., Jensen, Ø, Mendiola, D., Gabiña, G., . . . Black, K. D. (2015). A pan-european valuation of the extent, causes and cost of escape events from sea cage fish farming. Aquaculture, 436, 21-26. doi://doi.org/10.1016/j.aquaculture.2014.10.040

Kim, E. T. (2017). Washington State’s Great Salmon Spill and the Environmental Perils of Fish Farming. Retrieved from https://www.newyorker.com/tech/elements/washington-states-great-salmon-spill-and-the-environmental-perils-of-fish-farming

Kuterra Limited Partnership. (2014). Our Story. Retrieved from http://www.kuterra.com/our-story/

Mapes, L. V. (2017). State approves 1 million more farmed fish for Puget Sound, despite escape. Retrieved from https://www.seattletimes.com/seattle-news/environment/state-approves-1-million-more-farmed-fish-for-puget-sound-despite-escape/

Martya1, G. D., & Saksidab, A. S. (2010). Gary D. Marty. Retrieved December 04, 2017, from http://www.pnas.org/content/107/52/22599.full

McCarthy, T., & River, C. (2002). Is fish farming safe? Time Magazine. Retrieved from http://content.time.com/time/magazine/article/0,9171,391523-3,00.html

Naylor, R., Hindar, K., & Fleming, I.A. (2005). Fugitive Salmon: Assessing the Risks of Escaped Fish from Net-Pen Aquaculture. Bioscience 55.5. 427-37, https://doi.org/10.1641/0006-3568(2005)055[0427:FSATRO]2.0.CO;2.

National Oceanic and Atmospheric Administration Fisheries. (2017-a). Basic Questions about Aquaculture: Office of Aquaculture. Retrieved from http://www.nmfs.noaa.gov/aquaculture/faqs/faq_aq_101.html

National Oceanic and Atmospheric Administration Fisheries. (2017-b). NOAA Fisheries Releases Fisheries Economics of the U.S. and Status of Stocks Reports. Retrieved from http://www.nmfs.noaa.gov/stories/2017/04/05_feus_sos_reports.html

National Oceanic and Atmospheric Administration Fisheries. (2016). Status of stocks 2016. Retrieved from http://www.nmfs.noaa.gov/sfa/fisheries_eco/status_of_fisheries/archive/2016/status-of-stocks-2016-web.pdf

National Oceanic and Atmospheric Administration Fisheries (2013). Status of Stocks 2012. Retrieved from http://www.nmfs.noaa.gov/stories/2013/05/05_02_13status_of_stocks_2012.html

O’Neill, E. (2017). In the future, we might farm fish on land instead of in the sea. KCTS9. Retrieved from https://kcts9.org/programs/earthfix/in-future-we-might-farm-fish-land-instead-in-sea

Roberge, C., Normandeau, E., Einum, S., Guderley, H., & Bernatchez, L. (2008). Genetic consequences of interbreeding between farmed and wild atlantic salmon: insights from the transcriptome. Molecular Ecology 17(1). 314-24, DOI: 10.1111/j.1365-294X.2007.03438.x

SeaWeb. (2007). Fish Farms Drive Wild Salmon Populations Toward Extinction. Retrieved from https://www.sciencedaily.com/releases/2007/12/071213152606.htm

Schuitemaker, L. (2017). Lawsuits filed over Cooke Puget Sound salmon escape. Retrieved from http://salmonbusiness.com/lawsuits-filed-over-cooke-puget-sound-salmon-escape/

Scotland’s Aquaculture. (2017). Fish Escape. Retrieved from http://aquaculture.scotland.gov.uk/data/fish_escapes.aspx

Thorvaldsen, T., Holmen, I. M., & Moe, H. K. (2015). The escape of fish from norwegian fish farms: Causes, risks and the influence of organisational aspects. Marine Policy, 55. 33-38. http://dx.doi.org/10.1016/j.marpol.2015.01.008

Toledo-Guedes, K., Sanches-Jerez, P. & Brito, A. (2014). Influence of a massive aquaculture escape event on artisanal fisheries. Fisheries Management of Ecology 21. 113-121, doi: 10.1111/fme.12059

Van Zwol, J., et al. (2012). The effect of competition among three salmonidson dominance and growth during the juvenilelife stage. Retrieved December 05, 2017, from http://onlinelibrary.wiley.com/doi/10.1111/j.1600-0633.2012.00573.x/epdf


World Wildlife Fund (2017). “Overfishing.” WWF, World Wildlife Fund. Retrieved from www.worldwildlife.org/threats/overfishing.

Drilling in the ANWR and the Arctic Porcupine caribou problem

Alaska, Caribou, North Slope oil fields, Rangifer tarandus, Porcupine herd, moving past Prudhoe Bay Arctic Drilling Rig, North Slope, Alaska, 1978

The Arctic porcupine caribou has traversed the same migration path for the past 27,000 years. Surviving the last two major glaciations, the Arctic caribou once stood alongside Mastodons, Wooly Mammoths and Sabre-Tooth Tigers, but today they are being threatened (Maher, P., 2017). Chevron, British Petroleum, Arco and Exxon have begun to fight for the land the caribou have called home for decades. These companies want oil. Under the Arctic porcupine caribou, lies huge reserves of crude oil. Completely oblivious of the multi-billion dollar companies vying for the land beneath their hooves, the Arctic caribou teeters on the edge of disaster.

The Arctic National Wildlife Refuge (ANWR) established in 1960 by President Dwight D. Eisenhower, protects the Arctic’s “unique wildlife, wilderness, and recreational values” (US Fish and Wildlife Service, 2014). The ANWR expanses 19.64 million acres on the northern coastline of Alaska (National Park Service, n.d.). In 1980, this area’s future was solidified as President Jimmy Carter expanded the protection, designating much of it as “protected wilderness” under the Alaska National Interests Lands Conservation Act (ANILCA) (“A Brief History of the Arctic National Wildlife Refuge”, 2017). Protected wilderness, defined as the “wildest of the wild”, is “an area where the earth and its community of life are untrammeled by man, where man himself is a visitor who does not remain” (“Why Protect Wilderness”, n.d.). It contains no roads or other kinds of human development. It is the highest level of conservation protection offered by the federal government.

Within ANILCA, Section 1002 mandated a comprehensive assessment of natural resources on the 1.5 million acres of the refuge’s Coastal Plain. This assessment included research into fish, wildlife, petroleum, and the potential impacts of petroleum and gas drilling on the region. Because the ANWR Coastal Plain is discussed in Section 1002 of ANILCA, it is now referred to as the 1002 Area (U.S. Fish and Wildlife Service, [USFWS] 2014)

Much of what we know today about animal species in the ANWR comes from the ANILCA natural resource assessment. The ANWR is home to an array of 250 species of wildlife, including polar bears, Arctic caribou, grizzly bears, and various species of waterfowl (Alaska Wilderness League, 2017). The ANWR is the only national conservation area where polar bears regularly den and has become increasingly important as polar bear habitat is lost to climate change (Refuge Association, 2017). Birds from the ANWR migrate to every US state and territory, and can be found on 6 continents. The porcupine caribou herd, the largest caribou herd within the ANWR, returns every spring to the Coastal Plain to calve and raise their young (Refuge Association, 2017).

The ANWR porcupine caribou herd is one of the largest caribou herds in the world, with approximately 197,000 members (U.S. Fish and Wildlife Service, 2016). The ANWR is the only place on Earth that someone can find a porcupine caribou. The ANWR, home to a network of plains, waters and mountains, provides an environment unlike almost anywhere else. Its unique ecological composition makes it the perfect place for the porcupine caribou to live, raise their young and migrate throughout (“Frequently Asked Questions”, n.d.).

In the spring, the caribou leave their southern habitat and move north to the Coastal Plain of the ANWR. This is the preferred calving, or birthing, ground of the herd. Members of the herd travel anywhere from 400 to 3,000 miles to get to this area. After the caribou give birth in June, the herd remains on the Coastal Plain and forages until mid-July, allowing time for the calves to grow strong enough to journey south (Refuge Association, 2017).

The Coastal Plain is the preferred calving habitat of the porcupine herd for multiple reasons. The Plain has a small population of predators such as brown bears, wolves, and golden eagles. This gives calves a greater chance of survival in their youngest stages. The Coastal Plain also has an abundance of vegetation preferred by Arctic caribou. Vegetation thrives during the caribou calving period, providing pregnant and nursing caribou with the nutrition needed to survive the harsh conditions (Refuge Association, 2017). The ANWR Coastal Plain is the only place that the caribou could raise their young.

For thousands of years, the Gwich’in or “caribou people” of the ANWR have depended on the migrating arctic porcupine caribou for food, clothing, shelter and tools. The Gwich’in culture is so “interwoven with the life-cycle of the herd” that their survival as a people is completely dependent on the caribou (Albert, P., 1994). One fundamental Gwich’in belief is that “every caribou has a bit of the human heart in them; and every human has a bit of caribou heart.” Paul Josie, a member of one of the 13 Gwich’in villages, describes any “threat to the caribou is a threat to us… to our way of life” (Maher, P., 2017). Not only does the caribou satisfy these indigenous people’s spiritual needs, but the hunting and distribution of the caribou meat enhances their social interaction with other tribes in the area. The caribou has become a vital component of the indigenous people’s mixed subsistence-cash economy (Maher, P., 2017).

But the lives of both the porcupine caribou and the Gwich’in people are at risk. Oil development in the ANWR is threatening the migratory and birthing habits of the caribou, which in turn jeopardizes the Gwich’in way of life.

       If the ANWR was to be developed for oil production, it is estimated that 303,000 acres of calving habitat, or 37% of their entire natural calving habitat would be lost to human development (US Department of the Interior, p. 120). Furthermore, studies indicate there is a direct correlation between human development and a decrease in animal habitat quality of the ANWR. In areas within 4 km of surface development, caribou use of the land declined by 52% (Nelleman & Cameron, 1996, p. 26). There is an estimated 1,000 meter disturbance zone around oil wells and a 250 meter disturbance zone around roads and seismic lines (Dyer et al., 2001, p. 531). The most consistently observed behavior in response to these petroleum developments among calving caribou is avoidance of the petroleum infrastructure (Griffith et al., 2002, p. 34). Because the ANWR is currently undeveloped, drilling development would need to be widespread and has the potential to take up huge amounts of land. Roads, barracks, storage structures, well pads, and pipelines would all have to be created. The negative impacts on the caribou from human development would be amplified and enormous.

The human development would force calving caribou to move to other, less nutrient rich grounds outside of the Coastal Plain, but this would be disastrous. Caribou calf survival has been shown to be much lower in areas outside of the Coastal Plain (Johnson et al., 2005). In the late 90’s, snow cover reduced access to the foraging grounds of the Coastal Plain, forcing the Porcupine caribou herd to nearby Canada. When this happened, the calf survival rate of the herd dropped 19% (Griffith et al., 2002, p. 34).

Whether it is a good or bad thing, oil and gas are rooted in Alaskan society; oil drilling built Alaska. Much of what we know today about oil in Alaska comes from the same ANILCA research that looked into the porcupine caribou. Seismic exploration conducted to assess petroleum resources, determined that there are approximately 10.6 billion barrels of petroleum lying beneath the ANWR (U.S. Geologic Survey [USGS], 1998). For context, Alaska’s second largest oil field, Prudhoe Bay, contains only 2.5 billion barrels. (Harball, E. 2017). If drilling were to commence today, the ANWR would contribute about 2% of the total US daily oil production by 2020. By 2030, it would account for more than 10% of the US’s daily oil production. Between the years 2018 and 2030, the US would save $202 billion on foreign oil importation (Harball, E., 2016).

The impact of oil production on Alaska has been massive. Taxation on the North Slope has generated over $50 billion for the state. 80 percent of Alaska’s revenue comes from oil production. Statewide, the oil industry accounts for a third of all jobs, and is currently Alaska’s largest non-governmental industry (Alaska Oil and Gas Association [AOGA], 2017). Oil and gas generate 38% of all Alaskan wages. Even those who do not work in the oil industry benefit from Alaskan oil production. Today, Alaska’s citizens receive anywhere from $1000 to $2000 a year from the Alaska Permanent Fund. The Alaska Permanent Fund, created to ensure “all generations of Alaskans could benefit from the riches of the state’s natural resources” has paid out $21.1 billion to Alaskan residents since 1976. Oil has fueled Alaska’s meteoric rise to prominence, even catapulting the Alaska median household income to the second highest in the country (“Oil Payout”, 2015). If there was no oil, Alaska would be crippled.

A state already facing a $3 billion budget deficit, needs oil to function. With production from the North Slope already on the decline Alaska needs more oil. Alaska needs the Arctic National Wildlife Refuge. The Trans Alaska Pipeline, built to carry crude oil from Prudhoe Bay to Valdez (the northernmost point in America free of ice), stretches 48 inches in diameter. It was built this way to accommodate the large flow volumes from Prudhoe Bay, and the Arctic National Wildlife Refuge, where drilling was expected to begin shortly. At its peak, the pipeline would push almost 2 million barrels of oil a day. Today the pipeline is far below its optimum daily flow, averaging only about 515,000 barrels a day (Brehmer, E,. 2017). Around 1990, the North Slope, which supplies the bulk of the state’s oil production, peaked. Since then, oil production has been steadily decreasing and the flow through the Alaskan pipeline has been falling by 5 percent each year (Wight, P., 2017). With oil production slowing at Prudhoe Bay, the pipeline, and Alaska’s economy is in jeopardy.

With potentially ten billion barrels of oil in the 1002 region, pro-oil politicians throughout America and throughout Alaska call for the necessity to drill. They believe more drilling is the most immediate and easiest solution to the dwindling Alaskan oil production. Lisa Murkowski, the state’s senior senator and the chair of the Energy and Natural Resources Committee responsible for America’s use of natural resources, argues that oil is what has allowed for the development and upkeep of Alaskan “schools and roads and institutions”. She argues that in order to stay relevant and “to stay warm” in the face of a dwindling oil supply, drilling needs to occur in the ANWR (Friedman, 2017).

Murkowski, hoping to work around Section 1002, advocates for using Section 1003 of ANILCA which states “production of oil and gas from the Arctic National Wildlife Refuge is prohibited and no leasing or other development leading to production of oil and gas from the [Refuge] shall be undertaken until authorized by an act of Congress” (U.S. Fish and Wildlife Service [USFWS], 2014). Section 1003 basically states that ANWR can only be opened for drilling through an act of Congress.

In June, President Donald Trump announced his intention of withdrawing from the Paris climate accord, which is an international treaty focusing on fighting global warming and climate change. While other nations take steps to combat climate change, America’s current presidential administration has committed itself to fossil fuels. Donald Trump, with hopes of lessening America’s oil dependence on foreign governments, has taken up the call to open the 1002 area. The current administration has encouraged legislation that supports domestic energy expansion and has made it clear that they would like to continue America’s tradition of reliance on fossil fuels (Liptak, K., 2017).

Senate discussions led by Senator Murkowski, lean very heavily in favor of opening up the area to drilling. A referendum on the Tax Cuts and Jobs Act that was recently passed through Senate, authorizes the sale of oil and gas leases in a section of the ANWR. Soon, energy companies will be able to search for, and extract oil and gas from the frozen tundra (Meyer, R., 2017). Murkowski and the Trump administration has made ANWR drilling an almost guaranteed occurrence. With this approval of both the President and the committee chair responsible for natural resources in America, environmentalists need to recognize the real threat.

Environmentalist’s need to shift their focus from not drilling at all, to how drilling can be done in an environmentally conscious way. A practice that has the possibility to satisfy these criteria by reducing the environmental impact of oil drilling is Extended Reach Drilling (ERD). ERD is the practice of drilling non-vertical, very long horizontal wells. Extended reach drilling is a more advanced way to extract oil and is more efficient than traditional vertical well boring. Studies show that the ERD horizontal reach extends twice as far as standard vertical drilling methods (Bennetzen et al., 2010). Whereas standard reach drilling sites can only reach 4 km horizontally, an 8 km well is now considered standard depths for ERD (Finer et al., 2013). With distances of over 8 km being the norm, drill pads can be distanced at 16 km away from each other.  (“Average Depth of Crude Oil and Natural Gas Wells”, 2017) ERD wells reduce the area required to set up and drain oil reserves due to the drills extended radius. There is no need to build large amounts of drill pads to extract every oil reserve within a small area (Finer et al., 2013). Using extended reach drilling can drastically reduce the amount of land disruption caused by vertical drill wells. Habitat fragmentation, normally common around drilling sites, will be drastically reduced. Arctic caribou migration will not be affected as drastically as it would have been with standard reach drilling.

Studies from the Western Amazon have shown that half the drill pads normally used for standard reach drilling will be needed for ERD. Platforms were planned to be placed 8km away from each other, however ERD is capable of doubling that distance. All wells within a 16 km radius, were eliminated from the plan (Finer et al., 2013). The original plan consisted of 66 platforms, but 31 could be eliminated with extended reach drilling (Finer et al., 2013). Implementing ERD sites over standard platforms can save huge expanses of land from being disrupted, which directly translates to lessened environmental impacts to the ANWR.

Reducing infrastructure by using ERD sites will immediately reduce disruption of the land. Each new drilling platform requires approximately 5 to 11 acres of land, with an additional 14 acres for production phase processing stations. For example, Block 67, an area of land in the Western Amazon planned to use non-ERD sites consisting of 3 processing stations and 21 drilling platforms. This would require an environmental footprint of over 1 square kilometer. After implementing ERD sites into this scenario, 18 drilling platforms and one processing facility were eliminated, reducing land disruption by over 75% (Finer et al., 2013). ERD could preserve many acres of land for foraging caribou in the ANWR.

One concern for oil companies is the economic feasibility of using ERD platforms. Because it is a new technology, many companies are wary of its practicality. But Exxon Mobil, a leader in the world of oil production, understands it’s unique benefits. In their Russian Sakhalin-1 Project, Exxon uses ERD because they recognized the importance of the technology. To date, Exxon has drilled 43 of the world’s 50 longest-reach wells (“Extended reach technology”, n.d.). In the California OCS Santa Maria and Santa Barbara-Ventura basins, oil companies are considering using ERD to tap into 16 billion barrels of oil that lies off the California coast (California State Lands Commission [CSLC]). These oil companies would utilize ERD as an “economically and environmentally acceptable alternative” to traditional drilling sites. Fewer wells, reduced noise and air emissions, and the elimination of many new platforms incentivize these companies to use ERD. The long reach would significantly reduce the impact to the marine biology and habitats along the coast (“Oil and Gas Leases”, 2015). There would be minimal adverse effects on the environments, with most of the damage occurring in the marine survey and pre-development stage. When comparing EDR to traditional drilling, the economic benefits are enormous (Bjorklund, 2007).

With the passage of the Tax Cuts and Job Acts by the American senate and Alaska’s fossil fuel reliance, America has to prepare itself for drilling in the ANWR. America needs to understand and familiarize itself with the needs and necessities of the Arctic porcupine caribou. The caribou’s safety and livelihood must stay at the forefront of all drilling development conversations. Drilling needs to occur in the least consequential and most environmentally sustainable way possible. Extended Reach drilling is the answer. By reducing land disruption by 75%, and minimizing habitat fragmentation, ERD is the drilling practice that must be utilized to save the Arctic porcupine caribou. Alaska needs oil and the porcupine caribou need ERD.

AUTHORS

Justin Bates – Geology

Caitirn Foley – Environmental Science

Andrew Rickus – Building and Construction


REFERENCES

A brief history of the Arctic National Wildlife Refuge. (2017). Alaskawild.org. Retrieved 15 November 2017, from http://www.alaskawild.org/wp-content/uploads/2014/05/Arctic-Refuge-history-fact-sheet.1-25-17.pdf

Albert, P (April 1994). The Caribou Issue in Canadian-American Relations, Porcupine Caribou Management Board. Retrieved 1 December 2017, from http://arcticcircle.uconn.edu/ANWR/anwralbert1.html

Average Depth of Crude Oil and Natural Gas Wells. (2017). Retrieved November 28, 2017, from https://www.eia.gov/dnav/pet/pet_crd_welldep_s1_a.htm

Bennetzen, B, Fuller, J., Isevcan, E., Krepp, T., Meehan, R., Mohammed, N., . . . Sonowal, K. (2010). Extended-reach wells. Retrieved November 14, 2017, from https://www.slb.com/~/media/Files/resources/oilfield_review/ors10/aut10/01_wells.pdf


Bjorklund, T. (2007). The Case for Using Extended Reach Drilling to Develop California OCS Reserves from Onshore Locations. AAPG Database Inc., Retrieved from http://www.searchanddiscovery.com/documents/2007/07027bjorklund/


Brehmer, E., (2017). For the Alyeska team, it’s 40 years down and 40 to go. Alaska Journal of

Commerce, alaskajournal.com. Retrieved on December 1 2017, from

http://www.alaskajournal.com/2017-01-26/alyeksa-team-its-40-years-down-and-40-go#.Wh8cHrT80fF


Dyer, S., O’Neill, J., Wasel, S., & Boutin, S. 2001). Avoidance of industrial development by woodland caribou. The Journal of Wildlife Management, 65(3), 531-542. Retrieved from http://www.jstor.org/stable/3803106

Extended reach technology. ExxonMobil. Retrieved on December 2 2017, from http://corporate.exxonmobil.com/en/technology/extended-reach-technology/about/overview

Facts and Figures. (2017). Alaska Oil and Gas Association, aoga.org. Retrieved 14 November 2017, from https://www.aoga.org/facts-and-figures


Finer, M., Jenkins, C. N., & Powers, B. (2013). Potential of best practice to reduce impacts from oil and gas projects in the Amazon. PLoS ONE, 8(5), e63022. http://doi.org/10.1371/journal.pone.0063022


Friedman, L. (2017, November 1). An Alaska Senator Wants to Fight Climate Change and Drill for Oil, Too. Retrieved from https://www.nytimes.com/2017/11/01/climate/murkowski-alaska-anwr.html?_r=1

Frequently asked questions. Wilderness.nps.gov. Retrieved 15 November 2017, from https://wilderness.nps.gov/faqnew.cfm

Griffith, B., Douglas, D.C., Walsh, N.E., Young, D.D., McCabe, T.R., Russel, D.E.,…Whitten, K.R. (2002). The Porcupine caribou herd. U.S. Geological Survey, Biological Resources Division, Biological Science Report USGS/BRD/BSR-2002-0001.

Harball, E (2017). Alaska’s 40 Years Of Oil Riches Almost Never Was. npr.org. Retrieved on November 29 2017, from https://www.npr.org/2017/06/24/533798430/alaskas-40-years-of-oil-riches-almost-never-was

Harball, E., (2016). How much oil is really in ANWR?. alaskapublic.org. Retrieved on November 30, 2017, from https://www.alaskapublic.org/2016/12/07/how-much-oil-is-really-in-anwr/

Johnson, C., Boyce, M., Case, R., Cluff, H., Gau, R., Gunn, A., & Mulders, R. (2005). Cumulative effects of human developments on Arctic wildlife. Wildlife Monographs, (160), 1-36. Retrieved from http://www.jstor.org/stable/3830812

Liptak,K., (2017). WH: US staying out of climate accord. CNNpolitics, Retrieved on December 1 2017, fromhttp://www.cnn.com/2017/09/16/politics/trump-paris-climate-deal/index.html

Nellemann, C., & Cameron, R. (1996). Effects of petroleum development on terrain preferences of calving caribou. Arctic,49(1), 23-28. Retrieved from http://www.jstor.org/stable/40511982

Management of the 1002 Area within the Arctic Refuge Coastal Plain – Arctic – U.S. Fish and Wildlife Service. (2014). Fws.gov. Retrieved 15 November 2017, from https://www.fws.gov/refuge/arctic/1002man.html

Meyer, R., (2017). The GOP Tax Bill Could Forever Alter Alaska’s Indigenous Tribes. The Atlantic, theatlantic.com. Retrieved on December 2 2017, from https://www.theatlantic.com/science/archive/2017/12/senate-tax-bill-indigenous-communities/547352/

Oil and Gas Leases. (2015). California State Lands Commission, slc.ca.gov. Retrieved 15 November 2017, from http://www.slc.ca.gov/Info/Oil_Gas.html

Oil Payout: Alaskans find out how much they get (2015). Cbsnews.com. Retrieved on December 1 2017, from https://www.cbsnews.com/news/alaskans-eager-to-learn-amount-of-upcoming-oil-payout/

Maher, P (June 2017). Alaska’s Porcupine Caribou Herd – and the People it Helps Sustain. Retrieved on December 1 2017, from https://www.newsdeeply.com/arctic/articles/2017/06/09/alaskas-porcupine-caribou-herd-and-the-people-it-helps-sustain

US Department of the Interior (1987). Arctic National Wildlife Refuge, Alaska, Coastal Plain Resource Assessment. pubs.usgs.gov, pg 120. Retrieved from https://pubs.usgs.gov/fedgov/70039559/report.pdf

Why Protect Wilderness | Wilderness.org. Wilderness.org. Retrieved 15 November 2017, from http://wilderness.org/article/why-protect-wilderness

Wight, P., (2017). How the Alaska Pipeline Is fueling the push to drill in the Arctic Refuge. Yale Environment 360, e360.yale.edu. Retrieved on December 2 2017, from http://e360.yale.edu/features/trans-alaska-pipeline-is-fueling-the-push-to-drill-arctic-refuge


*The arguments/opinions expressed in this entry do not necessarily reflect the opinions/align with the author(s) own views.

Dam… The Atlantic Salmon Are Gone


They start out looking like little, orange colored, tapioca balls, floating in large bundles at the bottom of a steadily moving river. These Atlantic salmon eggs, born in the Connecticut River, are at the very beginning stages of their life, having just been fertilized by a fully mature male Atlantic salmon. They will continue to grow and develop within the freshwater river into parr, or adolescent salmon, for two to four years, before they leave their home tributaries in the spring months and begin a journey that will take them downriver, through estuaries, and hundreds or thousands of miles to ocean feeding areas (Hendry & Cragg-Hine, 2003, p. 4 and McCormick, S. D., Hansen, L. P., Quinn, T. P., & Saunders, R. L., 1998, p. 77). When the developing salmon finally reach the ocean they are known as smolt, and they will then migrate to the coasts of New England, Canada, Greenland, and even Spain, France and the UK, where they will live for around a year before they return to their birthing grounds to spawn the next generation of Atlantic salmon (Hendry & Cragg-Hine, 2003, p.3). Along with long migrations, smolt now face finding new food sources, diseases, parasites, and predators in the vast ocean they have arrived at (McCormick et al., 1998, p. 77). The smolt that survive and thrive in their new environment for one winter now earn the title of grilse (Miramichi Salmon Association [MSA], 2015). Because development, winter survival, and sexual maturation require high levels of stored energy, feeding and growth are of prime importance during freshwater residence (McCormick et al., 1998, p. 78).

Unfortunately, this hasn’t happened within the Connecticut River system since the early 1800’s. With the construction of Turners Falls dam in Massachusetts in 1800, the last recorded spawning of Atlantic salmon was in 1809 and there has been no historical population return since (Benson, Hornbecker, & Mckiernan, 2011, p. 11). Compared to an average of 100-200 Atlantic salmon in the Connecticut River in 1967, there were only about 75 salmon that returned in 2009 (Benson, Hornbecker, & Mckiernan, 2011, p. 12).

Atlantic salmon are important for supporting the ecology of the Connecticut River system and surrounding habitats. Developing fry and parr salmon offer ecological benefits to the Connecticut River system by feeding on and controlling populations of aquatic invertebrate larvae within the river, such as mayfly, stonefly, and caddis (Hendry & Cragg-Hine, 2003, p. 7). In addition, Atlantic salmon that spawn in the Northeast American river systems are also crucial to sustaining the Atlantic Ocean salmon population at large. Not only do they offer food for other species surrounding the Connecticut River, they also function as enormous pumps that push vast amounts of marine nutrients from the ocean to the rivers inland (Rahr, G., 2017). These nutrients are incorporated into food webs in rivers and surrounding landscapes by a host of over 50 species of mammals, birds, and other fish that forage on salmon eggs, juveniles, and adult salmon (Rahr, G., 2017). In Alaska, spawning salmon contribute up to 25% of the nitrogen in the foliage of trees (Rahr, G., 2017). With this information, we can infer that Atlantic salmon populations have the ability to contribute increased percentages of nitrogen to foliage surrounding the Connecticut River system.

A sustainable salmon population also offers economic advantages to the communities surrounding the Connecticut River system. High numbers of salmon bring an increase in public participation in fishing clubs like the Fish Creek Atlantic Salmon Club (Carey, 2017). With increased participation in fishing clubs and throughout fishing season, professional and recreational fishers spend a substantial amount of money on fishing trips. Aside from joining fishing clubs, in 2014, marine anglers in the US spent $4.9 billion on fishing trips and $28 billion on fishing equipment (National Oceanic and Atmospheric Administration [NOAA], 2017). In 2006, there were about 2.8 million recreational anglers in the New England region who took 9.7 million fishing trips (NOAA, 2006, p. 51). These anglers, in total, spent $438 million on recreational fishing trips and $1.44 billion on fishing-related equipment (NOAA, 2006, p. 51).  Retired Senator Elizabeth Hubley claims that the value of wild Atlantic salmon was once $255 million and the value to the surrounding areas in the gross domestic product was about $150 million (Atlantic Salmon Federation [ASF], 2017: Hubley, 2017). Increased Atlantic salmon populations also supported 3,872 full-time equivalent job in 2010, and about 10,500 seasonal jobs depend on wild Atlantic salmon (ASF, 2017; Hubley, 2017). These jobs include salmon angling and related tourism, food services, and accommodation sectors in the area (ASF, 2011, p. 54).

New England communities were built along banks of rivers so dams have been a central component since the beginning to provide water for irrigation, power generation, industrial operations, and provide clean drinking water. Specifically, the Connecticut River remains among the most extensively dammed rivers in the nation with 756 dams in place following the floods of 1932 and 1955 (American Rivers, 2017; & Benson, Hornbecker, & Mckiernan, 2011, p. 2 & 3). Two of the first dams on the Connecticut River system that prevent Atlantic salmon from migrating into tributaries are the Leesville Dam on the Salmon River and the Rainbow Dam on the Farmington River (Benson, Hornbecker, & Mckiernan, 2011, p. 20 & 22). The Leesville Dam was built in 1900 and is used for recreational purposes today. The second dam on the Connecticut River, the Rainbow Dam, was the first dam on the Farmington River, which is the largest tributary of the Connecticut River. This river is supposed to provide access to 52 miles of historic spawning habitat (Benson, Hornbecker, & Mckiernan, 2011, p. 22).

Now, Atlantic salmon face the biggest obstacle, figuratively and literally, they have ever encountered before. The Leesville and Rainbow dams are preventing Atlantic salmon from entering their respective tributaries and spawning each season. Dams are preventing upstream salmon passage, reducing water quality, altering substrate within the river, and alter flow regime of the river.

Dams placed on the Connecticut are the primary reason for the lack of returning Atlantic salmon to the Connecticut River system. Dams fragment habitat and ultimately prevent upstream salmon migration, which not only limits their ability to access spawning habitats, but also limits their ability to seek out essential food resources, and return downstream to the ocean (American Rivers, 2017). As a result, major dams on the in the Connecticut River watershed have blocked fish passage and caused significant decreases in Atlantic salmon migration and spawning rates (Daley, 2012, p. 1). A fish count was taken in 2010 and only found 1 Atlantic salmon was recorded above the Leesville Dam (Benson, J., Hornbecker, B., & Mckiernan, B., 2011, p. 20). Another fish count was taken above the Rainbow Dam and only showed 4 Atlantic salmon above the dam site (Benson, J., Hornbecker, B., & Mckiernan, B., 2011, p. 22).

Not only do dams physically prevent salmon from migrating upstream to spawn each season, they also slow down water velocities in large reservoirs which can delay salmon migration downstream (U.S. Fish & Wildlife Service, 2017). Additionally, dams can block or impede salmon spawning by creating deep pools of water that, in some cases, have inundated important spawning habitat or blocking access to it (U.S. Fish & Wildlife Service, 2017).

The water quality of the Connecticut River is very important in order to sustain Atlantic salmon populations because they require very good water quality, including high dissolved oxygen and low nitrates, non-ionized ammonia, and total ammonia content (Hendry & Cragg-Hine, 2003, p. 11). Although Atlantic salmon have a higher tolerance to warm temperatures than other salmon species, warm temperatures can reduce egg survival, stunt growth of fry and smolts, and increase susceptibility to disease (Klamath Resource Information System [KRIS], 2011). The chemical, thermal, and physical changes which flowing water undergoes when it is stilled can seriously contaminate a reservoir and even the water downstream (McCully, 2001). Water released from deep in a reservoir behind a high dam is usually cooler in the summer and warmer in the winter, while water from outlets near the top of the reservoir will tend to be warmer than river water year round. Unnatural or inverted patterns of warming or cooling of the river affect the ideal concentration of dissolved oxygen and adversely influences the biological and chemical reactions driven by temperature flux (McCully, 2001).

One experiment was conducted on the Colorado River in Glen Canyon, where pre-dam temperatures were obtained in varied seasons. The pre-dam temperatures varied seasonally from highs of around 27 ºC (80 ºF) to lows near freezing (McCully, 2001).  The maximum temperature of the river water that developing salmon can take is around 27 ºC (80 ºF) (KRIS, 2011). However, the temperatures of the water flowing through the intake of Glen Canyon Dam, 70 meters (230 feet) below the full reservoir level, varied only a couple of degrees around the year (McCully, 2001). The Colorado River is now too cold for the successful reproduction of native fish as far as 400 kilometers (250 miles) below the dam (McCully, 2001). This experiment is transferable to the Leesville and Rainbow dams because they are similar in size to the Glen Canyon Dam, therefore we can infer that both the Leesville and Rainbow dams impede fish populations because of drastic water temperature fluctuations year round.

The dams also stagnate downriver water flow, which is disadvantageous to the salmon because they cannot use the current of the river to guide them to the ocean to continue their life cycle before returning to spawn (American Rivers, 2017). Furthermore, dams that divert water for power also remove water needed for healthy in-stream ecosystems as well as directly affecting dramatic changes in reservoir water level, which can lead drying systems downriver (American Rivers, 2017). Furthermore, flow regime dictates substrate composition, or what makes up the bottom of a river channel. Slower moving water results in a riverbed of fine material, while faster flowing water tends toward a rockier or even bouldered substrate (Claeson, S. M., & Coffin, B., 2016). Research finds Atlantic salmon seem to prefer this rougher substrate, a habitat type that leads to an increase of 80% of individuals in a given area of 70% or more rocky or bouldered, substrate cover in studies of post partial or total dam removal. Researchers hypothesize the rocky substrate mitigates flow speed at greater depths, thereby facilitating salmon passage and providing refuge for salmon eggs and young (Lii-Chang, C. et al., 2008). Thus, a dam’s effect on flow regime and subsequent substrate composition is very detrimental to existing and future generations of Atlantic salmon.

In summary, the implementation of dams on the Connecticut River is harmful to Atlantic salmon populations in more ways than one. Connecticut River dams prevent salmon from migrating properly during their spawning periods. It became such a substantial problem that the National Fish Hatchery System (NFHS) of the U.S. Fish and Wildlife Service stocked Atlantic salmon in the Connecticut River at one point in time. Unfortunately, after poor returns back into the Connecticut River and its tributaries, the NFHA discontinued stocking Atlantic salmon in 2012 (U.S. Fish & Wildlife Service, 2017). In addition to impeding salmon migration, dams that were constructed also reduce water quality and alter the flow regime of the river and its tributaries.

Given the evidence dams present a steep hurdle for migratory, anadromous fishes, the natural evolution of the question then becomes; can we somehow mitigate that hurdle without removing the dam itself? Enter an attempt to do just that with the implementation of fishways around a dam. A fishway is a manmade path that allows for fish to safely pass around a dam without affecting the purpose of the dam (hydroelectricity, flood prevention etc.) (Harrison, 2008). There are two main types of fishways used today: fish ladders and fish lifts. A fish ladder is a system in which fish manually swim up and around the impending dam through a series of ascending pools (Edmonds, 2008, p. 1). Among the most common, pool and weir fish ladders utilize the flow of water over the ascending pools to encourage fish to jump up and into the next highest pool (Edmonds, 2008, p. 2). Another basic design called vertical slot fish ladder utilizes a small vertical slot in which the water flows into a pool. The angles of the entrance and exit slots create a holding area in each pool that the fish can rest in before battling the current to get to the next pool (Federal Energy Regulatory Commission [FERC], 2005).  A fish lift, however, is a hydraulic lift that automatically carries fish up and over the dam. Fish congregate at the base of the dam where they find the entrance to the fish lift. They then swim through this entrance and congregate in a holding tank at the base of the dam. Once there are enough fish in the holding tank, the tank is lifted to the height of the dam where fish are safely released on the other side (Harrison, 2008; Church, 2016).

One significant flaw with fishways is that they are not consistently effective for all fish species, especially Atlantic salmon. A fish lift put in place at the Holyoke dam on the mainstream of the Connecticut River kept track of how many fish passed through the elevator and their species. In 2010, the dam successfully passed: 164,439 American Shad, 39,782 Sea Lamprey, and only 41 Atlantic salmon (Benson, Hornbecker, & Mckiernan, 2011, p. 29). The Rainbow dam, which blocks a main tributary to the Connecticut River, conducted a study measuring what types of fish utilized its fish ladder. They found that three months after its installation in 2010, the vertical slot fish ladder passed: 548 American Shad, 3,090 Sea Lamprey, and only 4 Atlantic salmon (Benson, Hornbecker, & Mckiernan, 2011, p. 22). This data begs the question, why are some fishways more effective to certain species than others? Well, the answer is a lot more complex than people think. Alex Haro, a fish passage engineer at the S.O. Conte Anadromous Fish Research Center noted in 2014 that most of the design decisions made about fish ladders overlooked critical information (Kessler, 2014). Since fish ladder technologies developed with little cooperative partnership between engineers and fish biologists (Calles & Greenberg, 2009), attempts at engineering fish passage was often in the form of a one-size-fits-all solution for the sake of cutting costs. Examples of fatal oversights include a failure to calculate for critical variables that create what is referred to as ideal hydraulic conditions, such as speed, directional chop, and the physical and chemical qualities of water affected by a given dam as it relates to a fish species’ size, resilience, and overall passage efficiency (Brown & Limburg et al., 2013). Furthermore, design emphasis favored upstream passage potential, with little regard for returning downstream passage (Calles & Greenberg, 2009). Though even when fishways were designed with a target species in mind, passage was ever more ambitious than successful. Swedish ecological engineers found salmon-specific fish ladders prevented as much as 30% of potential spawning salmon from passing at the first mainstem dam and ultimately leading to an overall decrease of 70% of potential spawning salmon to reach high-quality spawning tributaries (Rivinoja, 2005).

As a way to bring the salmon populations back to the Connecticut River system, we advise the Connecticut state government to remove the Leesville and Rainbow Reservoir dams from the Connecticut River watershed. This solution will allow the restoration of salmon populations in the Connecticut River communities and bring with it economic, recreational, and ecological benefits to the surrounding areas.

In fact, areas that prioritized dam removal for the sake of habitat restoration are quickly witnessing a substantial recovery in both target fisheries and surrounding ecosystems, to include their local salmon species. The 210-foot-high Glines Canyon dam of Washington State was removed in the year 2014, following the removal of the Elwha dam in 2011, collectively reopening 70 miles, or 90%, of high-quality spawning habitat for salmon (Mapes, 2016). These two dams prevented a whole host of river wildlife from upriver passage for over a century, but the local Lower Elwha Klallam Native American tribe persevered and collaborated with state and federal officials to restore the habitat for their culturally important Coho and Chinook salmon (Mapes, 2017). And while the project came with a $325 million price tag, the effort is producing immediate ecological payoffs. Just three days after the Elwha dam removal, Chinook salmon were documented upriver the removal site (Mapes, 2016). The same year, in the 11-mile stretch between the two dams of century-long impossible spawning potential, the Elwha produced 32,000 outgoing juvenile Coho salmon (Mapes, 2016). Now, Chinook and Steelhead salmon numbers are up 350% and 300% respectively, and previously landlocked Sockeye salmon are returning to sea (Mapes, 2016). But the salmon aren’t the only winners in this story, downstream ecosystems have benefited from nutrient connectivity. As well, resulting physical and chemical changes to the river environment post-dam removal are creating more complex, and thus biologically rich, habitat structure for native species such as otter, various crabs, and birds (Mapes, 2016). One study out of Ohio State University evaluating Washington state’s efforts to remove dams concludes that birds with access to rivers hosting salmon, and therefore marine-derived nutrients, increases survival rates up to 11%, encourages multiple broodings per season of up to 20x, and increases the overall likelihood to stay year-round of up to 13x (Crane, 2015).

Destroying two dams in the Connecticut River watershed could come with major negative effects to the local societies. Because the Rainbow dam provides electricity to Hartford, CT, demolition of the dam will come with negative power ratings for the city, but how much of an impact will dam removal make? According to an excel sheet put together by the Department of Energy and Environmental Protection (DEEP), the Rainbow Dam in Windsor, CT has a capacity of .004 megawatts (MW) (2017). The best performing dam in America, the Grand Coulee Dam on the Washington River, has a capacity of nearly 7,000 MW (National Park Service, 2013). To put this number into perspective, if Hartford replaced 100 of its light bulbs with new energy efficient ones, it would successfully negate the power lost from removing the dam (American Rivers, 2016). Converting to newer energy alternatives in Hartford is a cheaper alternative, and could very easily negate the electricity loss from removing the Rainbow Dam.

The main problem with removing the Leesville dam is the recreational value that it holds. However, those who enjoy the open water will actually find that there is more to do without the dams there. Yes, people who had boats on the water will no longer have the ability to enjoy open waters, but the local area should see an upturn in use of the river. Now that the lake behind the Leesville dam is a river, kayaking and rafting will increase as there is more river length to explore unobscured by a dam. Also, as stated before, with more fish in the river, there is likely to be an increase in recreational fishing as well (American Rivers, 2017)

It is also important to consider the costs associated with maintenance of the dams and cost of demolition. One would think that the owner of the dam stands to lose the most when dam removal is considered, but in reality, this is not the case. In fact, the dam owners often work together with local, state, and federal governments to help get rid of the dam. This is because ownership of a dam also comes with maintenance and safety costs, as well as payments related to fish and wildlife protection (American Rivers, 2016). Costs for dam removal range from thousands to millions of dollars depending on sediment buildup, size of the dam, and complexity of river environment. Grant money and taxpayer money covers most of these payments, with some money coming from private investors (Benson, Hornbecker, & Mckiernan, 2011, p. 34 & 41).

In sum, Atlantic salmon populations will likely never be self-sustaining while hundreds of dams exist in the Connecticut River watershed (American Rivers, 2017). Especially when dams block nearly every tributary that feeds into the Connecticut River. Starting at the bottom of the Connecticut River, with the Rainbow and Leesville dam, we can slowly return natural spawning to the bottom of the river. By removing just two dams we successfully open access to over 70 miles historic spawning habitat (Benson, Hornbecker, & Mckiernan, 2011, p. 29; American Rivers, 2017). Luckily we are in a time where dam removal is picking up support. Out of the 1,150 dams that have been removed in the U.S. since 1912, approximately 850 of them have been in the past 20 years (Kessler, 2014). This upward trend of dam removal will heavily influence natural spawning in the Connecticut, and slowly but surely, those little, orange colored, tapioca balls will return home.

AUTHORS

Ava Swiniarski – Pre Veterinary Science

Jonah Hollis – Environmental Conservation Science

Ben Smith – Building and Construction Technology

REFERENCES

American Rivers. (2017). Connecticut River: New England strong. American Rivers. Retrieved from https://www.americanrivers.org/river/connecticut-river/


American Rivers. (2016). FAQ’s about removing dams. American Rivers. Retrieved from https://www.americanrivers.org/conservation-resources/river-restoration/removing-dams-faqs/


Atlantic Salmon Federation [ASF]. (2017). Freshwater recreational fisheries. Atlantic Salmon Federation. Retrieved from http://www.asf.ca/freshwater-recreational-fisheries.html


Atlantic Salmon Federation [ASF]. (2011) Economic value of wild Atlantic salmon. Atlantic Salmon Federation. 1-70. Retrieved from http://0104.nccdn.net/1_5/13f/2a0/0fe/value-wild-salmon-final.pdf


Benson, J., Hornbecker, B., & Mckiernan, B. (2011). The impacts of dams on river ecosystems. 0-55. Retrieved from https://web2.uconn.edu/hydrogeo/secure2215/nre2011presentations/group6_dams_fishways.pdf


Brown, J. J., Limburg, K. E., Waldman, J. R., Stephenson, K., Glenn, E. P., Juanes, F. and Jordaan, A. (2013), Fish and hydropower on the U.S. Atlantic coast: failed fisheries policies from half-way technologies. Conservation Letters, 6: 280–286. doi:10.1111/conl.12000


Calles, O. & Greenberg, L. (2009), Connectivity is a two-way street—the need for a holistic approach to fish passage problems in regulated rivers. River Res. Applic., 25: 1268–1286. doi:10.1002/rra.1228


Carey, E. (2017). Fish Creek Atlantic salmon club, inc. Retrieved from http://fishcreeksalmon.org/


Church, D. (2016). Tour highlights Rainbow dam and fish ladder. Retrieved from http://www.courant.com/community/windsor/rnw-wn-0611-rainbow-dam-tour-20150602-story.html


Claeson, S. M., & Coffin, B. (2016). Physical and biological responses to an alternative removal strategy of a moderate-sized dam in Washington, USA. River research
and applications
, 32(6), 1143-1152. Doi: 10.1002/rra.2935


Crane, M. (2015). River ecosystems show ‘incredible’ initial recovery after dam removal. Phys.Org. Retrieved from https://phys.org/news/2015-12-river-ecosystems-incredible-recovery.html


Daley, B. (2012). US bid to return salmon to Connecticut River ends. 1-4. Retrieved from www.bostonglobe.com/lifestyle/health-wellness/2012/08/04/federal-government-abandons-quest-return-salmon-connecticut-river/1KZjIwOYlCdquJL4ogIAhK/story.html


Department of Energy and Environmental Protection [DEEP]. (2017). Certified renewable energy facilities. Retrieved from http://www.ct.gov/pura/cwp/view.asp?a=3354&q=415186


Edmonds, M. (2008). What are fish ladders? Retrieved from https://adventure.howstuffworks.com/outdoor-activities/fishing/fish-conservation/fish-populations/fish-ladder.htm


Federal Energy Regulatory Commission [FERC] (2005). Styles of fishways. Retrieved from https://www.ferc.gov/CalendarFiles/20110928144951-Day1-part-2a.pdf


Harrison, J. (2008). Fish passage at dams. Retrieved from https://www.nwcouncil.org/history/FishPassage


Hendry, K., & Cragg-Hine, D. (2003) Ecology of Atlantic salmon. Conserving Natura 2000 Rivers, (7), 3-32. Retrieved from http://ec.europa.eu/environment/life/project/Projects/index.cfm?fuseaction=home.showFile&rep=file&fil=SMURF_salmon.pdf


Hubley, E. (2017) Economic benefits of recreational Atlantic salmon fishing- inquiry. Liberal Senate Forum. Retrieved from http://liberalsenateforum.ca/hansard/economic-benefits-of-recreational-atlantic-salmon-fishing-inquiry/


Kessler, R. (2014). Mimicking nature, new designs ease fish passage around dams. Retrieved from http://e360.yale.edu/features/mimicking_nature_new_designs_ease_fish_passage_around_dams


Klamath Resource Information System [KRIS] (2011). Water temperature and Gulf of Maine Atlantic salmon. Retrieved from http://krisweb.com/krissheepscot/krisdb/html/krisweb/stream/temperature_sheepscot.htm


Lii-Chang, C., Hsing-Juh, L., Shao-Pin, Y., Chyng-Shyan, T., Chao-Hsien, Y.,  & Cheng-hsiung, Y.. (2008). Relationship between the Formosan landlocked salmon Oncorhynchus masou formosanus population and the physical substrate of its habitat after partial dam removal from Kaoshan Stream, Taiwan. Zoological Studies., 47.


Mapes, L. V. (2017). At Elwha River, forests, fish, and flowers where there were dams and lakes. The Seattle Times. Retrieved from https://www.seattletimes.com/seattle-news/environment/at-elwha-river-forests-fish-and-flowers-where-there-were-dams-and-lakes/


Mapes, L. V. (2016). Elwha, roaring back to life. The Seattle Times. Retrieved from https://projects.seattletimes.com/2016/elwha/


McCormick, S. D., Hansen, L. P., Quinn, T. P., & Saunders, R. L. (1998). Movement, migration, and smolting of Atlantic salmon (Salmo salar). Can. J. Fish. Aquat. Sc, 55(1), 77-92. Retrieved from http://www.bio.umass.edu/biology/mccormick/pdf/cjfas%2098%20movement,%20migration%20and%20smolting.pdf


McCully, P. (Eds.) (2001). Silenced Rivers: The ecological and politics of large dams. London, England. Zed Books. Retrieved from https://www.internationalrivers.org/dams-and-water-quality


Miramichi Salmon Association [MSA]. (2015) Life cycle of Atlantic salmon. Miramichi Salmon Association. Retrieved from http://www.miramichisalmon.ca/education/atlantic-salmon/


National Oceanic and Atmospheric Administration [NOAA]. (2017) Angler expenditures and economic impact assessments. NOAA Office of Science and Technology. Retrieved from https://www.st.nmfs.noaa.gov/economics/fisheries/recreational/angler-expenditures-economic-impacts/index


National Oceanic and Atmospheric Administration [NOAA]. (2006) New England summary. New England Region. 49-53. Retrieved from https://www.st.nmfs.noaa.gov/st5/publication/econ/2006/NE_Summary_Econ.pdf


National Park Service (2013). Washington: Grand Coulee Dam. National Park Services. Retrieved from https://www.nps.gov/articles/washington-grand-coulee-dam.htm


Rahr, G. (2017). Why protect salmon. Wild Salmon Center. Retrieved from https://www.wildsalmoncenter.org/work/why-protect-salmon/


Rivinoja, P. (2005). Migration problems of Atlantic salmon (Salmo salar L.) in flow regulated rivers. Diss. (sammanfattning/summary) Umeå : Sveriges lantbruksuniv., Acta Universitatis agriculturae Sueciae, 1652-6880; 2005:114. ISBN 91-576-6913-9


U.S. Fish & Wildlife Service (2017a). Salmon of the west: Why are salmon in trouble? – dams. Retrieved from https://www.fws.gov/salmonofthewest/dams.htm


U.S. Fish & Wildlife Service (2017b) Atlantic salmon. Retrieved from https://www.fws.gov/fisheries/fishguide/atlantic_salmon.html

Are you herring me? Restoring river herring through dam removal

1 year after a dam removal in CT

In 1965, commercial fishermen topped out at a catch of 65 million pounds of river herring in Maine. They were plentiful then and there was no worry they would ever be any less abundant. However as fishing techniques continued to advance, fishermen in Maine have only been able to catch just over 2 million pounds once since 1993. The population has dwindled down so much that a report on September 4, 2017, claims the federal government is reviewing the proposal for river herring to go under the Endangered Species Act (Whittle 2017). Once a bountiful fish, now on the brink of endangerment. Why? One of the causes is due to extreme damming, erupting 14,000 new dams in New England (Hall et al., 2012).

River herring are relatively small fish that rely on coastal rivers to spawn. They are anadromous fish, which means that they migrate between freshwater and saltwater during breeding portions of their life cycle. Once river herring swim up rivers, they spawn in streams and ponds in the spring. Their young will then return to the ocean in the fall. River herring need ponds, lakes, and slow moving small streams in order to spawn (Hall et al., 2012; Hall et al., 2010). The term river herring includes several species of fish such as alewives, blueback herring, and American shad. They are often collectively referred to as river herring because they share very similar biological characteristics. River herring are a key member of the food chain for many commercially and ecologically important species. They feed on lower, smaller organisms which allows them to potentially exist in large numbers (Hall et al., 2012). Without access to key coastal rivers, the adults have no place to spawn and entire watersheds lose these valuable fish. River herring are important members of many New England watersheds and coastal zones.

River herring numbers have shown a massive decline over the course of the colonization of New England (Hall et al., 2012). Since the 1600s, yearly available river herring biomass has decreased by 30 million kg, which is roughly 11.8 billion fish lost from potential yearly harvest (Hall et al., 2015). This means that river herring are not reproducing nearly as much as they used to. River herring were once vastly abundant fish that provided substantial amounts of nutrients to freshwater and marine ecosystems alike. New England has a history of fishing and Native Americans once harvested the seemingly unlimited bounty of fish. Even though New England river herring used to occur in the billions, their numbers quickly fell as their breeding grounds were cut off by dams.

River herring are a potential prey item for a variety of predatory fish, such as cod, striped bass, and many others (Hall et al., 2012; Willis et al., 2017). River herring are important prey items because they contain more nutrients than many other invertebrates. River herring have higher levels of proteins and lipids, making them a higher quality prey item for predatory fish (Willis et al., 2017). Due to restoration efforts striped bass numbers have risen, causing them to expend more pressure on other valuable species such as juvenile Atlantic salmon (Hall et al., 2012, Hall et al., 2010). This particular case is a result of a predator being restored without the presence of its typical prey item, causing striped bass to eat other unintended fish. Predator fish that eat river herring are major contributors to the local coastal economies of New England. In three major fishing communities in New England: New Bedford, MA, Gloucester, MA, and Portland, ME, caught ground fish that eat river herring were worth a total of  $48.7 million and employed 347 boats from large to small in 2016. These numbers represent only a fraction of the overall fishing industry in New England that are affected by river herring and show that there is a large economy that could benefit from their restoration. There is also a mussel, known as the alewife mussel, that depends on alewives to complete its life cycle. Following a trend in river herring restoration in 1985, alewife mussels experienced improved abundance and range expansion (Hall et al., 2012). This data clearly displays the importance of river herring in freshwater and marine ecosystems. By protecting river herring, we are indirectly helping numerous other organisms that are important to the New England economy.

With the importance of river herring in mind, the issue of dams arise. Dams have been constructed in waterways in the northeastern U.S. since the arrival of European colonists in the seventeenth century. Records dating back to the 1600s have proven that dams have significant impacts on watershed ecosystems. The impacts of damming include, but are not limited to: loss of habitat, stream alterations, and changes in water flow and temperature. These impacts can have serious implications for anadromous fish that inhabit dammed coastal waterways in New England, such as river herring. Dams can often block access to key spawning grounds for river herring. These physical barriers, unless modified with a fish ladder or passage, are almost always impassible and prevent river herring from spawning upstream of these areas. There are over 14,000 dams in New England alone that have caused virtually every watershed in the region to be affected by dams (Hall et al., 2012, Hall et al., 2010). Dams disrupt the flow of water and sediment to downstream portions of rivers, creating a poor habitat for several fish species (Hogg et al., 2015). Dams can also cause water temperature to increase, making much of the watershed uninhabitable for some fish, as well as disrupting migration patterns of river herring (Kornis et al., 2015). River herring are important spring and fall prey for predator fish and when increasingly warmer rivers disrupt these seasonal migration patterns, predator fish are adversely affected. From these observations, it can be inferred that dams have considerable, negative impacts on river herring and New England watersheds as a whole.

For centuries, dams have impeded river herring from crossing the boundary between freshwater and ocean water. Since river herring are anadromous, it is imperative that they have access to both freshwater and saltwater to complete spawning. When passage from the waterway to the ocean is inhibited, river herring experience a great loss of accessible habitat, causing detrimental shifts in their ability to thrive. From 1634 to 1850, significant reductions in anadromous spawning habitat, due to dam construction on tributaries and small watersheds, reduced river herring lake habitat in Maine by 95% (Hall, Jordaan, Fox, et al., 2010). Construction of large dams on primary river heads resulted in a virtually complete loss of available habitat by the 1860s (Hall et al., 2010). Such extensive habitat loss led to the severe decline of river herring, putting them on the brink of endangerment and giving them their current classification as a species of concern.

It is understood that of the 14,000 dams in New England, the vast majority of them have historical and personal values associated with local residents. As a result, there has not been a single dam removal project in New England without some type of opposing group (Sneddon et al., 2017, Fox et al., 2016). Opposing groups include local historical societies, residents with connections to local dams, and residents with specific views on the natural state of their watersheds. Dam removal projects such as the Warren Dam, East Burke Dam, Mill Pond Dam, and the Swanton Dam have been halted after concerted efforts to keep them (Fox et al., 2016). Residents often develop a cultural bond with their dams and resist dam removals due to perceived loss in heritage site (Sneddon et al., 2017, Fox et al., 2016). Fox et al. (2016) quote an example of a grassroots organization member in opposition of the Swift River dam removal in central Massachusetts who said, “If you kill the dam, you kill a part of me.” There is also a disconnect between what scientists believe is the natural state of a stream and what residents believe is the natural state of their watershed (Sneddon et al., 2017, Fox et al., 2016). Instead of viewing dam removal as a method of river restoration, many residents of New England tend to see it as a historical and ecological disturbance.

Local residents living near a dam may feel that the dam contributes to their cultural and ecological systems. Differing ideas about what counts as natural is attributed to three factors: attachment, attractive nature, and rurality (Jørgensen 2017 p.841). An example of contradicting viewpoints takes place in Nanaimo, Canada. There was a proposal to remove the Colliery Dams and the Colliery Dam Preservation Society protested the removal, claiming they would lose “the lakes in this very special park” and it was supposed to be a “legacy for our children, their children and all future generations” and that their rebuttal slideshow only provides a “glimpse into the beauty and uniqueness of a very special place” (Jørgensen 2017 p.847). This further proves that the driving factors of the Colliery Dam Preservation Society is due to their attachment, the attractive nature of this park, and their perception of rurality. In a debate between for and against- removal parties, Charles Thirkill, a fisheries biologist, criticizes those who spoke fondly of the fish in the lakes because they were farm-raised sterile fry, almost as artificial as the Atlantic salmon that are raised in net pens (Jørgensen 2017 p.848). This sparks a realization for those against dam removal and the preservation of the “natural” state of the park because what they were so fond of is really all artificial or man-made.

It is important to understand that all stakeholders have different perceptions of what is natural. As previously mentioned, Jørgensen (2017) explains all the perceptions of what the word natural means, however a man-made physical barrier does not happen without the work of man. Since it is decreasing the abundance of anadromous fish, dams should be removed for the sake of fish populations as well as other ecological benefits. Keeping a park intact is important for the culture of local communities however there are other ways of conserving a park even with the removal of a dam. Parks can be shifted over, it can incorporate the new river, or if a reservoir is drained out, it can be made into walkways, gardens, fields, and so forth.

New England differs from other parts in the country in that it is controlled by mostly private lands, meaning that locals have a strong influence on the decisions made in their town (Sneddon et al., 2017; Fox et al., 2016). As a result dam removal processes begin with long town hall like debates, where all parties voice their particular positions (Sneddon et al., 2017; Fox et al., 2016). In Durham, Vermont, the mill dam is a key feature of the town, its industrial history, a major tourist spot, and even appearing on the town seal. Yet after receiving two letters of deficiency from the state, residents claimed it is “one of the most photographed sites in Vermont and, it could be argued, is an essential part of the single most important resource in the town – it’s beauty,” (Fox et al., 2016, p.98). Despite the state’s suggestion to remove the dam, it still remains standing.Dams can play an important role in the culture of local communities and removing them can be hard for many. Removing dams can create newly revived rivers in which communities can find their own sense of beauty and culture. By embracing the benefits of dam removal and in many cases in cheaper costs than repairing dams, local historians may be able to accept the loss of one resource for the benefit of another.

Dams are historical structures and so the request to remove them may be hard for those who feel a strong connection to the dam. With this, it is important to consider the dangers of keeping an old dam. A case where dams go horribly wrong would be in Johnstown. In the late 1800s, Johnstown was a thriving town located in western Pennsylvania. Just 14 miles away was the South Fork Hunting & Fishing Club. This club restored an abandoned earthen dam and created Lake Conemaugh which was used for sailing and ice boating and was stocked with expensive game fish (Hutcheson 1989). The new dam raised concerns for Daniel Morell, one of Johnstown’s best civic leaders, and so he inspected it to find that this dam was in need of dire attention. He sent numerous letters to the club and the town hall, however they were all dismissed. After several days of heavy rainfall, on May 31, 1889, the dam breached (Hutcheson 1989). 20 million tons of water crashed down onto the town of Johnstown taking trees, railcars, and entire houses in its path leaving 2,200 dead. Chicago Herald’s editorial afterwards was entitled “Manslaughter or Murder?” shining light on South Fork Club’s complete negligence for several warnings of the dam’s breach (Hutcheson 1989). 13% of dams in the US are considered highly hazardous and could cause damage such as in Johnstown (NDSP). This means there are 1,820 dams in New England that could pose significant damage to their communities and may serve as potential clients for removal to avoid these potential disasters.

There are many benefits to dam removal yet these are often not fully understood or superseded by locals desire to keep dams as part of their cultural history. A dam removal in Greenfield, Massachusetts was halted after multiple years of 17 organizations coordinating the project with already $500,000 spent on the removal. Yet there are ways that advocates for dam removal can effectively achieve their goals. In Maine conservation, under the Natural Resources Protection act, advocates can petition to the state to remove a permanent structure if it poses significant harm to a natural resource, especially wetlands and watersheds (MDEP, 2016). This could give states more power to remove dams in Maine that harm their natural resources. Across New England there are many federal and state grants available to remove dams (EOEEA, 2007). In Rhode Island the Pawtuxet Falls dam was removed with the help of the Pawtuxet River Authority and Narragansett Bay Estuary Program that sought funding from a dozen sources, including, R.I. Saltwater Anglers Association, the US Environmental Protection Agency, the National Oceanic and Atmospheric Administration, and the US Fish and Wildlife Service (NRCSRI, 2011). These can allow conservation commissioners independent funding that is not depend on local town support. In the cases where dams are need of repairs were the cost is too high for the town to pay then conservation commissioners can pay for their removal.  There are 50 dams in New England currently under review for removal and as dams age this number will slowly increase (Fox et al. 2016). To Truly restore river herring their spawning habitat needs to be restored and this can happen by removing dams. By targeting dams with no economic benefits that are in need of costly repairs, a precedent can be set for slowly removing the many dams of New England and restoring river herring habitat.

The removal of the Edwards dam on the Kennebec River in Maine highlight the importance of dam removal for river herring (Hall et al. 2012, Robbins and Lewis, 2008). The Kennebec River is one of Maine’s largest river system and covers a full 132 miles. It provided an ample supply of anadromous fish until the Edwards Dam was constructed. This resulted in an immediate loss of 17 miles of spawning habitat for river herring (Robbins and Lewis 2008). After the removal of Edward’s Dam, four Atlantic Salmon in the first time in 162 years have finally reached the upper Kennebec River. From there, the amount of anadromous fish re-entering the Kennebec have continued to increase (Robbins and Lewis 2008). An ex post survey on the economic effects, it was concluded that more anglers have come to fish at the restored fishery and are willing to pay more for better angling opportunities since the removal of the Edward’s Dam (Robbins and Lewis 2008).

Removing dams have economic benefits to the surrounding area. Many cases such as Edwards Dam in Maine and Whittenton Pond Dam in Massachusetts, prove that their repairing outlived dams costs more than removing them. Not only is removing a dam more cost efficient, it also brings more jobs and revenue from the improvement of recreational fishing and activities.

Edward’s Dam is a prime example of a successful removal with economic benefits. As mentioned before, many residents in the surrounding area had ties to this dam and the park it was associated with. Alternatives were considered to improve the life cycle of anadromous fish and so to install fish passages it would cost $14.9 million. The cost to just remove the dam would be four million less at $10.9 million (FERC 1997). Edward’s Dam was thus removed and by doing so, they generated $397,000 -$2.7 million in new income, amounting to benefits totaling $4.9 million to $61.2 million over 30 years (Industrial Economics 2012). As well as generating vast income, another dam removal case proved to prevent a major financial loss.

Whittenton Pond Dam in Mill River, Massachusetts was beyond repair and was at risk for a catastrophic breach. This was a 10-foot high and 120-foot wide wood and concrete structure built in 1832 to power a textile mill and when the mill was shut down, the dam was no longer maintained (Headwaters Economics 2016). Removing the dam would have four benefits: cost effectiveness, avoided emergency response cost, protection of vulnerable species, and increased property values. The cost of removing the dam was $447,000 whereas to rebuilding it estimated to be $1.9 million, and options to repair the dam with a fish ladder or bypass would cost even more than rebuilding it (MDFG 2015). The dam was later removed in 2013, preventing $1.5 million in emergency response expenses if the dam was left for a catastrophic breach to occur. With these figures in mind, it is apparent that removing the Whittenton Pond Dam is the most cost effective option. Thus the dam was removed. This opened up 30 miles of river habitat to vulnerable fish species so that they can spawn, and have nutrients and minerals evenly distributed to previously blocked off areas (MDFG 2015). The removal of the dam is expected to increase property values upstream and downstream of the dam site, lifting the economy of the town (Lewis, Bohlen, and Wilson 2008).

Dam removal is a successful method for restoring river herring because they can rapidly colonize new areas (Hogg et al., 2015, Hall et al., 2012). Hogg et al. (2015) showed in their study that alewives colonized the above dam portion of the studied river within two years. This river had been cut off to those river herring for over a century (Hogg et al., 2015). Hall et al. (2012) claims river herring are ideal for restoration because of their high reproduction rate, allowing them to proliferate rapidly. Hall et al. (2012) also claims that river herring have a rate of straying, meaning that they visit other streams to spawn. This means that a healthy population can rapidly spread to other areas and colonize them. If broad scale stream restoration was done, then existing populations such as the Damariscotta River population in central Maine, would be able to easily colonize newly formed habitat. This shows that dam removal is an effective way of restoring river herring populations.

New England was once a hub for factories and the production of machined goods. We once needed dammed rivers to more through the industrial revolution but it has been well over a century since New England relied on water power. Even though many residents have become accustom to the status of our watersheds it has had major effects on the quality of our ecosystems. We longer need mills but recreational and commercial fishing has existed in New England for over 400 years and will continue to do so. We once made drastic changes to our environment to suit our need and it is now time to make more drastic changes in order to restore the damages that we have caused. There are many dams in New England that are in hazardous conditions that would be far cheaper to remove. By targeting these degraded dams, trying to convince or suppress locals that are against dam removals, and effectively fund these projects, dam removal can greatly restore New England watersheds. The benefits of removing dams will have noticeable and long last economic and environmental benefits to New Englanders and therefore dam removal should be a real consideration for restoring streams in the Northeast.

AUTHORS

Quentin Nichols – Natural Resources Conservation

Jessica Vilensky – Natural Resources Conservation

Suzanna Yeung – Building & Construction Technology


REFERENCES

Hogg, R.S., Coghlan Jr., S.M., Zydlewski, J. & Gardner, C. (2015) Fish community response to a small-stream dam removal in a Maine coastal river tributary. Transactions of the American Fisheries Society, 144(3), 467-479. DOI: 10.1080/00028487.2015.1007164

Lewis, L.Y., Bohlen, C., Wilson, S. (2008). Dams, Dam Removal, and River Restoration: A Hedonic Property Value Analysis. Contemporary Economic Policy. 26( 2): 175-186

Robbins, J.L., Lewis, L.Y. (2008). Demolish it and they will come: Estimating the economic impacts of restoring a recreational fishery. Journal of the American Water Resources Association. 44, 6, 1488-1499.

Jørgensen, D., (2017). Competing ideas of ‘natural’ in a dam removal controversy. Water Alternatives. 10(3): 840-852.

Sneddon, C.S., Magilligan, F.J. and Fox, C.A. (2017). Science of the dammed: Expertise and knowledge claims in contested dam removals. Water Alternatives 10(3): 677-696

Willis T.V., Wilson, K.A., Johnson, B.J. (2017). Diets and stable isotope derived food web structure of fishes from the inshore Gulf of Maine. Estuaries and Coasts. 40:889–904 DOI 10.1007/s12237-016-0187-9

Hall, C. J., Jordaan, A., & Frisk, M.G. (2012). Centuries of anadromous forage fish loss: Consequences for ecosystem connectivity and productivity. BioScience 62: 723–731.  doi:10.1525/bio.2012.62.8.5

Fox, C. A., Magilligan, F. J., Sneddon, C.S., (2016). “You kill the dam, you are killing a part of me.” Dam removal and environmental politics of river restoration. Geoform 70(2016) 93-104.  http://dx.doi.org/10.1016/j.geoforum.2016.02.013 0016-7185/

Hall, C. J., Jordaan A., & Frisk, M.G. (2010). The historic influence of dams on diadromous fish habitat with a focus on river herring and hydrologic longitudinal connectivity. Landscape Ecol (2011) 26:95–107 DOI 10.1007/s10980-010-9539-1

Federal Energy Regulatory Commission (FERC), (1997). Final Environmental Impact Statement: Kennebec River Basin, Maine. Federal Energy Regulatory Commission

Industrial Economics Inc. (2012). The economic impacts of ecological restoration in Massachusetts. Massachusetts Department of Fish and Game Division of Ecological Restoration

Massachusetts Department of Fish and Game (MDFG) (2015). Economic & Community Benefits from Stream Barrier Removal Projects in Massachusetts. Massachusetts Department of Fish and Game

Kornis, M., Weidel, B., Powers, S., Diebel, M., Cline, T., Fox, J., & Kitchell, J. (2015). Fish community dynamics following dam removal in a fragmented agricultural stream. Aquatic Sciences, 77(3), 465-480. doi:10.1007/s00027-014-0391-2

National Dam Safety Program (NDSP) (Dec 2003). Dam Safety and Security in the United States: A Progress Report on the National Dam Safety Program in Fiscal Years 2002 and 2003. FEMA. Retrieved from

https://www.fema.gov/media-library-data/20130726-1514-20490-6660/fema-466.pdf

Executive Office of Energy and Environmental Affairs (EOEEA) (December 2007). Dam

Removal in Massachusetts: A Basic Guide for Project Proponents. Mass.gov. Retrieved from http://www.mass.gov/eea/docs/eea/water/damremoval-guidance.pdf

Hutcheson, E. (1989). Floods of Johnstown:1889-1936-1977. Cambria County Tourist

Council. Retrieved from Johnstown Area Heritage Association website.

http://www.jaha.org/attractions/johnstown-flood-museum/flood-history/

Maine Department of Environmental Protection(MDEP) (2016). Protecting Natural Resources.

Maine.gov. Retrieved from http://www.maine.gov/dep/land/nrpa/index.html

Natural Resources Conservation Service Rhode Island (NRCSRI) (2011). Pawtuxet River

Restoration Commemoration. United States Department of Agroculture. Retrieved from

https://www.nrcs.usda.gov/wps/portal/nrcs/detail/ri/home/?cid=nrcs144p2_016765

Whittle, P. (2017). River herring, hurt by dams and climate, might be endangered. AP News.

Retrived from AP News website.

https://www.apnews.com/8589b5630a7a43d7aea62a4900b83d35

Cooling Albuquerque, New Mexico, with Green Roofs

A city does what it has to in order to be sure its citizens can stay safe and protected in the midst of so many dangerous events like crime and murder. One dangerous outcome may come traditionally undetected and that is deaths related to heat waves. San Francisco did all that it could to protect against such a disastrous attack like setting up shelters with air condition, making swimming pools open and free to the public, and opening four air conditioned libraries. This was not enough. Over the Labor Day weekend heat wave of 2017, where temperatures reached triple digits, three elderly people, all in their late 70s to early 90s, died due to the heat wave (Swan, 2017). In San Mateo county in California, just outside of San Francisco, the coroner said three more elderly people died from shock because of the heat wave over the same Labor Day weekend. (Rocha, 2017). The Intergovernmental Panel on Climate Change agrees that heat waves are more likely to be more intense in cities due to the already high temperatures from the Urban Heat Island effect. (IPCC AR5, 2014, p.7-8). This exacerbates the conditions usually seen in heat waves, so not only do cities experience higher temperatures, but also more deaths related to these rising temperatures. Only three names were made public, but like the deaths of Patrick Henry, 90, Ernesto Demesa, 79, and Loraine Christiansen, 95, all of San Mateo county, more elderly are at risk during these heat waves compared to the rest of the population. (Rocha, 2017). Green roofs can help alleviate rising temperatures and urban heat island effect in cities.

Cities, on average, are affected more by heat waves than surrounding areas due to the urban heat island effect. The Urban Heat Island (UHI) effect is the heating of urban areas, typically cities, due to the design and material choice of urban architecture and the high volume of emissions emitted from transportation, which it then trapped in the urban environment. (Monteiro et al., 2017). A city like Albuquerque, New Mexico has experienced temperature differences of up to 22°F between the city and the surrounding rural areas on an average summer’s day, Albuquerque is number two in the United States for the greatest difference in temperature between city and rural communities (Hot and Getting Hotter, 2014). Temperatures inside the city have reached up to 100°F five times in 2016 alone, and the hottest day on record in Albuquerque was 107°F on June 26, 1994 (US Department of Commerce, 2016 ). This increase in temperature causes fatal living conditions. (Monteiro et al., 2017).

Rising temperatures from UHI has also been known to cause heat exhaustion, heat cramps, non-fatal heat stroke, respiratory issues and even heat-related mortality (United States Environmental Protection Agency [EPA], 2017). These results are more likely to affect sensitive populations like young children and older adults, like those in San Mateo county. (EPA, 2017).

Cities have little to no vegetation. Vegetation promotes evapotranspiration which can help reduce temperatures by 2° F to 9°F (EPA, 2017). The effects presented by decreased reflectivity, increased heat retention, and lower evapotranspiration is like wearing a black wool sweater on a hot July day in the desert. If you wear a black wool sweater in the middle of the summer, your sweat is going to be trapped in the sweater, and prevent evaporation, unlike a moisture wicking white t-shirt which allows your sweat to evaporate off of you and carry away the heat. One way to think of this in effect is also the way that humid air feels warmer, because your sweat won’t evaporate, whereas dry heat feels cooler because of its ability to absorb moisture and allow evaporative cooling.

The white t-shirt will also be able to reflect more sunlight due to its lighter color compared to the black sweater. Green roofs are the white cotton t-shirt, a good solution to feeling hot while succumbing to the conditions of the black wool sweater as the urban heat island effect. In order to mitigate some of the UHI effects in Albuquerque, New Mexico, the New Mexican government must create incentive programs to help encourage the design and development of green roofs.

A large factor contributing to UHI is the reduced albedo caused by dark surfaces, used on roads and roofs, decreasing reflectivity and increasing heat retention. (Morini, Touchaei, Rossi, Cotana, & Akbari, 2017). Albedo is a measure for how well a surface reflects light without absorbing it in the form of heat (Morini et. al, 2017). Urban architecture plays a big role here. Since pavements and roofs typically constitute over 60% of urban surfaces, increasing reflectivity will drastically increase albedo and decrease UHI (Akbari, Menon & Rosenfeld, 2009). Decreased albedo, or decreased reflectivity, has been known to raise the temperatures of exposed urban surfaces, like rooftops and pavement, to temperatures 50°F to 90°F warmer than ambient air temperatures, whereas shaded surfaces, or rural surroundings, remain closer to air temperatures (EPA, 2017). Because rural areas do not have such an abundance of these dark materials, rural areas are 18°F to 27°F cooler during the day than nearby cities (EPA, 2017).

There is a cycle that begins when UHI occurs in a city. UHI causes an increase in air temperatures and leads to uncomfortable living conditions, that is then countered with an increase in air conditioning. Warmer environments lead to more air conditioning and energy use, therefore UHI will cause an increase in energy use through an increase in air conditioning. Research shows that there is a 1.5 – 2.0% increase in electricity demand for every 1°F increase (EPA, 2017)

An increase in energy demand due to UHI effects will require power plants to produce more energy which will emit greenhouse gases into the atmosphere and add to the already pressing issue of climate change. CO2 is the most prominent greenhouse gas and is primarily caused by the burning of fuel in order to produce energy (EPA, 2017). With multiple days reaching temperatures over 100°F in Albuquerque, UHI and its effects result in huge spikes of energy consumption. Greenhouse gasses trap heat in the atmosphere and increase temperatures (The Greenhouse Effect, 2017). Because of the effects of UHI, power plants will need to produce more energy to meet the demand and emit additional CO2 into the atmosphere in the process. This increase in CO2 will contribute to climate change in the form of a greenhouse gas. All of these causes lead to the urban environment experiencing greater temperatures than before, which brings the cycle back to the issue of having to increase air conditioning usage, it is a perpetual cycle that is harming the environment by contributing to climate change and heating up the urban environment.

The IPCC states that climate change is real and is increasing temperatures at an unprecedented rate. They are “virtually certain” that there will be more hot and fewer cold temperature extremes over as temperatures continue to increase. This rise in temperatures has a direct effect on UHI and heat waves. The Fifth Report put out by the IPCC states that it is very likely that heat waves will occur more often and last longer than previous years and that it is very likely the cause of human activities like burning fossil fuels. (IPCC AR5, 2014, p. 7-8).

Given that this cycle caused by human activity it only seems fit that there should be an initiative taken to break the cycle. The cycle begins with urban architecture increasing the temperatures of an urban environment and inside of buildings, and by using green roofs we can reduce the temperature of both the urban environment and inside of buildings. Green roofs reduce the effects of UHI through its high reflectivity and its ability of evapotranspiration.

A green roof’s reflectivity has drastic effects on the temperature of the outdoor air when compared to a traditional roof. During a normal sunny day, a green roof’s increased reflectivity can cause the temperature of the roof top surface to be cooler than the temperature of the air, as opposed to a traditional roof in which the surface temperatures can be upwards of 104°F warmer than the air (William et al., 2016). By increasing the solar reflectivity of a roof top, the outdoor air temperature will be lower, and will reduce the demand for air conditioning.

Another way that greater reflectivity reduces energy requirements of a building is by reducing the through roof heat gain (TRHG). TRHG flux is higher for roofs with a lower solar reflectivity, regardless of the region (Kibria, O’Brien, Alvey, & Woo, 2016). By increasing the reflectivity of a roof the indoor air temperatures will be lower too, by preventing heat from entering a building through the roof. Reflectivity has two benefits, both lowering the outdoor air temperature of the urban environment and the indoor air temperature of a building.

Green roofs will reduce energy demands by decreasing a building’s ability to absorb heat. Green roofs cause a cooling effect called evapotranspiration. This sensation is essentially to a building like sweating is to a human, the water on the green roof evaporates into the atmosphere and carries away its embodied heat. By having plants on a roof, the water they use and obtain will absorb heat that would have been absorbed into the building. The water then evaporates, reducing the amount of heat that could have potentially been absorbed into the rooftop and into the building. Less heat is absorbed by the rooftop and transferred to the building (William et al., 2016).

Although there are benefits to green roofs some are opposed to them due to the higher upfront cost and higher maintenance cost. The cost per square foot ranges from $10 to $25 and the annual maintenance of green roofs is $0.21 up to $1.50 per square foot (EPA, 2017). These figures are dependent on the types of plants, the media, and the extent of maintenance and irrigation.

This in turns forces a lot of pressure on the owners to absorb this cost of installation and also puts pressure to maintain them as well. In Southern California, if only half of the roofs are green, then $211 million will be saved in heating and cooling cost in the long run (Garrison, Horowitz 2012). In a University of Michigan study, a 21,000 square foot green roof would cost $464,000 to install versus $335,000 for a regular roof. The study also says that the green roof would save up to $200,000 in reduced energy costs (U.S. Environmental Protection Agency, 2008). With green roofs having multiple benefits and the upfront cost being minimal compared to the savings, it seems reasonable to have this cost be a part of buildings plan.

In order to mitigate the negative impacts of urban heat island in Albuquerque, the city must provide an incentive program for green roofs for new buildings. An incentive program would encourage developers by educating them on the benefits of green roofs and by covering a portion of installation cost. There are a number of places in the world that have recognized the many benefits of green roofs and adopted them into their urban development programs. Canada has been one of the leading countries in North America when it comes to green infrastructure legislation, especially in Toronto, Ontario where green roof programs have been implemented since 2006. (City of Toronto, 2017).

In 2006 Toronto, Ontario initiated the Green Roof Incentive Pilot Program to promote the design and development of green roofs on privately owned commercial/ industrial buildings. After one year the program was deemed “very successful” by the city and had awarded 16 applications with grants resulting in over 32,290 square feet of green roofs on new buildings (City of Toronto, 2017). After receiving feedback from the applicants about the pilot program it was determined that although it was successful, they could attract more applicants by increasing the incentive to $5 to square foot which was average for similar incentive programs in the country. (Gironimo, 2007). Within 5 years it was reported by the program coordinator that this program supported a total of 112 projects with a total of 2,507,991 square feet, reducing energy consumption by an estimated 565 MWh, avoiding 106 tons of greenhouse gases (Baynton, 2015, para. 3).

In order to be eligible for this grant the developer must have provided documentation of a design and maintenance plan for the green roof of a new building. This program did not offer grants for developers retrofitting green roofs due to the variables with the type of roofing materials and the amount of weight the building was designed to support. Minimum coverage requirements ranging from 20% for small roofs and up to 60% for larger roof tops were also put into effect. Although larger roofs require 60% of coverage there was a cap of $100,000 for the grant (City of Toronto, 2017). This program is in use today in Toronto and is now a key part of their Climate Change Action Plan and is complimented by the Green Roof Bylaw where the installation of eco-roofs is mandatory for new buildings.

Since this program has shown to be successful over a long period of time according to the city of Toronto, this same sort of incentivized program would be viable for Albuquerque. This program would also provide grants for eligible applicants at $5 per square foot for up to $100,000 for new industrial and commercial buildings and have the same eligibility requirements. With a $5 per square foot incentive, this would cover 20%-50% of installation cost on an average greenhouse relieving pressure from the developers. In order for this plan to work, builders must be educated on the number of benefits for this system by providing resources like pamphlets, websites, and seminars in order to communicate the value of these systems and how the long term benefits outweigh the initial costs.

In order to break the UHI cycle and the rapid increase in temperatures in Albuquerque there must be an incentive program run by the city or state government. Government officials need to address this issue since it impacts the health and well-being of its inhabitants. The impacts on health have led to death and other health complications and with temperature continuing to rise, it seems reasonable to assume the amount of deaths, complications, and general discomfort will rise too. In order for people to alleviate themselves from high temperatures, they must turn to cooling technology. Rising temperatures means that buildings must increase the amount of fossil fuels used to cool buildings which increases not only the cost of cooling, but the amount of greenhouse gases, in this case CO2, in the atmosphere. Greenhouse gases then go on to contribute to rising temperatures in cities which then continues the cycle.

Green roofs can help to break this cycle by helping to reduce the amount of heat trapped in these urban areas by increasing evapotranspiration and reflectivity. By increasing these two properties, less heat is retained in the buildings which then decreases the amount of fossil fuels used to cool buildings and reducing the amount of greenhouse gases in the air.  By implementing an incentive policy that educates and encourages developers to install green roofs, the impacts of UHI will decrease. Unless the New Mexico government steps in, like Toronto, and provide incentives to green roof installation the cycle could continue on indefinitely affecting more families like those in San Francisco.

AUTHORS

Evan Brillhart – Natural Resource Conservation

Jacqueline Dias – Environmental Science

Michael Pfau – Building and Construction Technologies

Amanda Tessier – Horticultural Science

REFERENCES

Akbari, Menon, and A. Rosenfeld, 2009: Global cooling: Increasing world-wide urban albedos to offset CO2. Climatic Change, 94 (3–4), 275–286, doi:10.1007/s10584-008-9515-9.

Baynton, A. (2015, January 16) Toronto’s Eco-Roof Incentive Program. C40 Cities. Retrieved from: http://www.c40.org/case_studies/toronto-s-eco-roof-incentive-program

City of Toronto. (2017). Eco roof incentive program. Retrieved from: https://web.toronto.ca/services-payments/water-environment/environmental-grants-incentives-2/green-your-roof/

Garrison, N., & Horowitz, C. (2012). Looking Up: How Green Roofs and Cool Roofs Can Reduce Energy Use, Address Climate Change, and Protect Water Resources in Southern California. NRDC Report. Retrieved from https://www.nrdc.org/sites/default/files/GreenRoofsReport.pdf.

Gironimo, L.D. (2007). Green roof incentive pilot program(AFS# 3677). Retrieved from City of Toronto: http://www.toronto.ca/legdocs/mmis/2007/pg/bgrd/backgroundfile-3302.pdf

Huber, D. G., & Gulledge, J. (2011). Extreme Weather and Climate Change: Understanding the Link and Managing the Risk. Center for Climate and Energy Solutions. Retrieved from https://www.c2es.org/site/assets/uploads/2011/12/white-paper-extreme-weather-climate-change-understanding-link-managing-risk.pdf.

Hot and Getting Hotter: Heat Islands Cooking U.S. Cities. (2014, August 20). Retrieved from http://www.climatecentral.org/news/urban-heat-islands-threaten-us-health-17919

IPCC, 2014: Climate Change 2014: Synthesis Report. Contribution of Working Groups I, II and III to the Fifth Assessment Report of the Intergovernmental Panel on Climate Change [Core Writing Team, R.K. Pachauri and L.A. Meyer (eds.)]. IPCC, Geneva, Switzerland, 151 pp.

Kibria K. Roman, Timothy O’Brien, Jedediah B. Alvey, OhJin Woo, Simulating the effects of cool roof and PCM (phase change materials) based roof to mitigate UHI (urban heat island) in prominent US cities, In Energy, Volume 96, 2016, Pages 103-117, ISSN 0360-5442, https://doi.org/10.1016/j.energy.2015.11.082. (http://www.sciencedirect.com/science/article/pii/S036054421501703X)

Monteiro, M., Blanua, T., Verhoef, A., Richardson, M., Hadley, P., & Cameron, R. W. F. (2017). Functional green roofs: Importance of plant choice in maximising summertime environmental cooling and substrate insulation potential.Energy & Buildings, 141, 56-68. doi:10.1016/j.enbuild.2017.02.011

Morini, E., Touchaei, A. G., Rossi, F., Cotana, F., & Akbari, H. (2017). Evaluation of albedo enhancement to mitigate impacts of urban heat island in rome (italy) using WRF meteorological model doi://doi.org/10.1016/j.uclim.2017.08.001

Rocha, V. (2017, September 8). Six deaths linked to Bay Area heat wave – LA Times. Retrieved from http://www.latimes.com/local/lanow/la-me-ln-six-deaths-heat-wave-bay-area-20170908-story.html

Swan, R. (2017, September 07). 3 deaths in SF likely caused by weekend heat wave. Retrieved from http://www.sfchronicle.com/bayarea/article/3-deaths-in-SF-likely-caused-by-weekend-heat-wave-12178945.php?utm_campaign=sfgate&utm_source=article&utm_medium=http%3A%2F%2Fwww.sfgate.com%2Fbayarea%2Farticle%2FDeath-toll-from-Bay-Area-heat-wave-hits-6-12180514.php#photo-14063884

The Greenhouse Effect. (n.d.). Retrieved December 2, 2017, from https://scied.ucar.edu/longcontent/greenhouse-effect

US Department of Commerce, NOAA, National Weather Service. (2016, September 26). NWS ABQ – 100 Degree Facts for NM. Retrieved from https://www.weather.gov/abq/clifeatures_100degrees

U.S. Environmental Protection Agency. 2008. “Green Roofs.” In: Reducing Urban Heat Islands: Compendium of Strategies. Draft. https://www.epa.gov/heat-islands/heat-island-compendium.

United States Environmental Protection Agency [EPA]. (2017). Heat Island Impacts. Retrieved from https://www.epa.gov/heat-islands/heat-island-impacts

United States Environmental Protection Agency [EPA]. (2017). Overview of Greenhouse Gases. Retrieved from https://www.epa.gov/ghgemissions/overview-greenhouse-gases

United States Environmental Protection Agency [EPA]. (2017). Using Trees and Vegetation to Reduce Heat Islands. Retrieved from https://www.epa.gov/heat-islands/using-trees-and-vegetation-reduce-heat-islands

William, R., Allison, G., Ashlynn S., S., Meredith, R., Phong V.V., L., & Praveen, K. (2016). An environmental cost-benefit analysis of alternative green roofing strategies. Ecological Engineering, 951-9.

Fighting Fire with Fire: Effective Fuel Reduction Treatments Preventing Severe Wildfires


Northern California residents are used to dealing with large-scale wildfires erupting near and within their hometowns. However, this past October saw dozens of extreme wildfires simultaneously sweeping across Napa, Sonoma, and Solano counties (Holthaus, E., 2017). Soon after these eruptions, thousands of people were forced to evacuate their homes, 1,500 structures had been destroyed, and eleven people were reported dead. Governor Jerry Brown promptly declared California in a state of emergency making the National Guard available. After one week, one of these fires named the Tubbs Fire, became California’s most destructive wildfire in history, taking 21 lives and destroying 5,643 structures (The California Department of Forestry and Fire Protection [CALFIRE], 2017). Thousands of wildland firefighters worked day and night attempting to contain this fire, only receiving on average three hours of sleep a night (Westervelt, 2017). Ultimately the wildfires were uncontrollable, subsequently destroying thousands of wineries significantly hitting local economies. California Lt. Gov. Gavin Newsom stated that enormous fires interfacing with high population areas is unfortunately the new norm. Just this year, California fires have burned twice as many acres than 2016, and the average amount burned over the past five years (CALFIRE, 2016).

Contrary to popular belief, low severity and frequent wildfires that occur every 1-25 years are key to perpetuating healthy stands of certain forest types, especially in the western U.S (Pacific Northwest Research Station, 2015). Just one hundred years ago, the Northwestern forests contained many gaps in their canopies, and their understories were not very dense (Hessburg et al, 2005, p. 117).  Low severity fires sculpted these forests by keeping the buildup of vegetation at bay which created breaks in continuous fuel, also known as combustible vegetation (Washington, G.W). Breaks in fuel deter mega fires from spreading across the landscape (Hessburg et al, 2005, p. 132). Fire is imperative to forested ecosystems of the Pacific Northwest because it not only reduces stand density and accumulation of vegetation, but there are many ecological benefits such as nutrient recycling, reproduction, and germination, (Hessburg et al, 2005, p. 118).

Approximately a century ago, the U.S. Forest Service (USFS) began putting these important fires out leading to a plethora of excessively dense stands with continuous, built-up fuels (Stephens et al., 2012., p. 549). The USFS were allotted money from an emergency fund allowing them to fight fires without chewing into their own budget (Houtman et al, 2013, p.A) During this century, the West entered a period of intensive logging where the largest trees were repeatedly cut, and many small trees all filled the gaps left behind simultaneously, cutting system called highgrading (Hessburg et al, 2005, p.120; p. 122). Years of fire suppression plus highgrading has transformed the forested landscapes of the Pacific Northwest to be now overly stocked stands, or groups of trees with uniform characteristics, of similar age (Snyder, M., 2014).

Wildfires in the US have been strongly affected by all aspects of global climate change. Climate change has altered current atmospheric patterns especially average air temperatures significantly impacting fire regimes (Huang et al, 2015, p. 89). Warming means that regions will experience drier than normal conditions conducive to extreme fire outbreaks (Harvey, C., 2017). The amount of moisture in vegetation decreases under warmer conditions because of a decrease in relative humidity, and an increase in evapotranspiration rates, or the process in which water is transferred from the land and foliage to atmosphere through evaporation (Huang et al, 2015, p. 89). Wildfires feed off dry fuels because fuels with lower moisture levels take less time to burn, therefore making wildfire behavior more erratic and unpredictable (Flannigan et al, 2009, p. 492) Studies show that in response to drier climatic conditions, the frequency of large fires in the Northwestern US has increased by 1000% since 1970 (Schoennagel et al, 2017, p. 4538) Warming also increases fire severity in being a sharp increase in the amount of area burned in  future predicted fires. In fact, this year alone has seen approximately a 23% increase of acres burned nationally compared to the average amount from 2006-2016 (National Interagency Fire Center [NIFC], 2017).

Not only do extreme wildfires kill off enormous amounts of trees, they also destroy thousands of homes and structures annually. Since 2011, there has been eleven wildfire outbreaks each causing at least one billion dollars in damages (Center for Climate and Energy Solutions, 2011). This October, over 20,000 citizens were evacuated from Santa Rosa California and the neighboring communities to flee from the devastating flames that destroyed everything in their path (Fuller et al, 2017, October 10). Due to past land use history coupling climate change, management through prescribed burning must be implemented at a fast rate to reduce the accumulation of dry fuels, or this megafire trend will only continue to worsen.

One of the most common means of managing forest fires as mentioned before is through prescribed burning. This is where a section of the forest, typically the understory, is purposely ignited to allow for the reduction of fuel to ultimately decrease the size, severity, and frequency of wildfires. (United States Geological Survey, 1999). This is usually done by small federal or state-level ground crews that are trained to maintain control of the fire. This form of management may not work on all landscapes, however it is a proven method in reducing fuel loads effectively.

On the coast of Southern Alabama, multiple prescribed burns were administered every 2-3 years in a Longleaf Pine dominated forest (Outcalt & Brockway, 2010, p. 1615). After eight years, the resulting forest structure and composition consisted of an open Longleaf Pine dominated overstory with a reduction in a woody understory and increase in an herbaceous layer (Outcalt & Brockway, 2010, p. 1622). This description is an ideal Longleaf Pine ecosystem because the build-up of a woody and dense understory heavily increases severe wildfire risk.

Much of the public is concerned about prescribed burning due to a lack of understanding. Some people fear of the chance prescribed burns might go awry and become impossible to contain. However, during the period of 2002-2006, the USFS could not contain 38 out of 3,640 controlled burns performed, which is a 99% success rate (Deirdre, D & Black, A., 2006). Considering how damaging wildfires can be, the chance of a prescribed burn becoming uncontrollable and destructive is quite negligible.

Due to negative opinions regarding prescribed burning and political constraints, there has not be and is not nearly enough prescribed burning being conducted throughout the U.S., especially on Pacific Northwestern national and state forests. After thirteen years, the USFS did prescribed burning on only 4.7% of Oregon’s 15.7 million acres of national forests and administered an even slimmer 1.4% of Washington’s 9.3 million acres (Brunner, J & Bernton, H., 2015, October 20). When broken down by region, of the 11.7 million acres burned using prescribed burning in 2014, the Southeast burned 8 million acres, 69% of the total amount performed throughout the U.S. When compared with western agencies, they only performed 27% of the total acres burned (Coalition of Prescribed Fire Councils, Inc., 2015).

With the expansive amount of information covering the effectiveness of prescribed burning, the question remains why the West is conducting significantly less prescribed burning than the South. Part of the reason lies in fire being an accepted component of southern culture, in fact many southern laws support prescribed burning being done on private property by private non-commercial practitioners and private contractors (Kobziar et al, 2015, p. 565). There are much stricter laws in some regions of the Pacific Northwest limiting the amount of prescribed burning allowed. For instance, the Clean Air Act requires the EPA to enforce states to mandate certain levels of six common pollutants determined by the National Health-based Ambient Air Quality Standards (Engel K.H., 2013, p. 647). For states implementing significant amounts of prescribed burning, the EPA enforces them to carry out smoke management plans (SMPS) that include ways of minimizing smoke from prescribed burns and topics such as what agency will authorize burn permits (Engel K.H., 2013, p.656).

As mentioned earlier Oregon is conducting more prescribed burning than Washington state; Oregon federal and state agencies burned over 450,000 acres between 2010-2015 while Washington state and forest agencies burned less than 150,000 acres (Banse, T. 2016, February 3). Washington State Senator Linda Evans Parlette told the Northwestern News Network that the answer lies partially in these strict smoke management laws the Washington Department of Natural Resources (DNR) imposes on the agencies and people of Washington. To get a prescribed burning plan approved in the state of Oregon, an agency or forest landowner must submit it to the District of Forestry state forester (Battye et al, 1999, p. 101). In order to get a plan approved in Washington state involved a lot more steps: agencies doing prescribed burns of 100 tons of fuel or more, which an average timber burn exceeds, must submit a permit to the DNR complete with pre-burn data and steps for collecting post-burn data (Battye et al, 1999, p. 141). In addition, the DNR region manager must screen the burn site and review the atmospheric conditions the day before the scheduled burn. Finally, the region manager must provide the final approval the day of the planned burn (Battye et al, 1999, p. 142). A solution to these inflexible smoke management laws that date back to the 90’s is modifying the clauses within each state’s’ SMP to allow for more prescribed burns to occur, especially in the west.

House Bill 2928 is a bill recently passed by Washington State Legislature in March 2016, aiming to make prescribed burning authorization more lenient (House Bill 2928, 2016). In summary, the bill calls for burn plans to be approved 24 hours before the scheduled burn as opposed to the day of. In addition, it reclassifies prescribed burning as “forest resiliency burns” allowing for controlled burns to be conducted on days that regular outdoor fires are prohibited. Finally, the bill states that burn permits can only be revoked by the DNR when the prescribed burn is highly likely to result in heavy air quality violations or other safety issues.

With projected warmer temperatures and less precipitation in the future due to global climate change, wildfires will likely increase in many areas of the country, especially of those in the western United States. However this does not necessarily have to mean that the severity of these wildfires has to increase as significantly as projected. Prescribed burning offers an effective treatment to reduce hazardous fuel loads. Moving towards the future we must increase knowledge of the public and politicians on fire ecology, which is a natural process in many western ecosystems.  We also must pass bills that concentrate around the initiative that fire management, both proactive and active, is needed and will be needed even to a greater extent in the future.  If this does not happen, key funding and initiatives may be lost because costs will only increase with more frequent, high severity wildfires. Fire has always been a part of the Western United States ecology and with the changing climate, precautions must be taken to insure low severity prescribed burns are administered to reduce the likelihood of frequent and severe wildfires looking towards the future.

AUTHORS

Gerald Barnes – Natural Resources Conservation with a Concentration in Wildlife Conservation

Oscar Hanson – Building Construction and Technology

Rebecca Holdowsky – Natural Resources Conservation with a Concentration in Forest Ecology and Conservation

REFERENCES

Banse, T. (2016, February 3). Washington state lawmakers want to fight fire with fire more often. Northwest News Network. Retrieved from http://nwnewsnetwork.org/post/washington-state-lawmakers-want-fight-fire-fire-more-often

Battye, R., Bauer, B., & MacDonald, G. (1999 September).Features of prescribed fire and smoke management rules for Western and Southern states. EC/R Incorporated, 1-156. Retrieved from https://www.wrapair.org//forums/fejf/documents/woodard.pdf

Brunner, J & Bernton, H. (2015, October 20). Fighting fire with fire: State policy hampers use of controlled burns. Seattle Times. Retrieved from https://www.seattletimes.com/seattle-news/environment/fighting-fire-with-fire-state-policy-hampers-use-of-controlled-burns/

The California Department of Forestry and Fire Protection [CALFIRE]. (2017, November 29). Top 20 most destructive california wildfires. Retrieved from http://www.fire.ca.gov/communications/downloads/fact_sheets/Top20_Destruction.pdf

CALFIRE. (2016, September 23). Incident statistics. Retrieved from http://cdfdata.fire.ca.gov/incidents/incidents_stats

Center for Climate and Energy Solutions. (2011). Wildfires and climate change. Retrieved from https://www.c2es.org/content/wildfires-and-climate-change

Coalition of Prescribed Fire Councils, Inc (2015). 2015 NATIONAL PRESCRIBED FIRE USE SURVEY REPORT. Retrieved from http://stateforesters.org/sites/default/files/publication-documents/2015%20Prescribed%20Fire%20Use%20Survey%20Report.pdf

Deirdre, D & Black, A. (2006). Learning from escaped prescribed fires – lessons for high reliability. Retrieved from https://www.fs.fed.us/rm/pubs_other/rmrs_2006_dether_d001.pdf

Engel, K.H. (2013). Perverse incentives: The case of wildfire smoke regulation. Ecology Law Quartely. (40)3, 622-672. Retrieved from http://scholarship.law.berkeley.edu/cgi/viewcontent.cgi?article=2023&context=elq

Ensuring that restrictions on outdoor burning for air quality reasons do not impede measures necessary to ensure forest resilience to catastrophic fires, House Bill 2928. (2016) Retrieved from http://lawfilesext.leg.wa.gov/biennium/2015-16/Pdf/Bill%20Reports/House/2928%20HBR%20AGNR%2016.pdf

Flannigan, M.D., Krawchuk, M.A, de Groot, W.J., Wotton, M.B., & Gowman, L.M. (2009). Implications of changing climate for global wildland fire. International Journal of Wildland Fire, 18(5), 483-507. doi:10.1071/WF0818

Fuller, T., Perez Pena, R., & Bromwich, J.E., (2017, October 10). California fires lay waste to 140,000 acres and rage on. Retrieved from https://www.nytimes.com/2017/10/10/us/california-fires.html?action=click&contentCollection=U.S.&module=RelatedCoverage&region=Marginalia&pgtype=article

Harvey, C. (2017) Here’s what we know about wildfires and climate change. Scientific American. Retrieved from https://www.scientificamerican.com/article/heres-what-we-know-about-wildfires-and-climate-change/

Hessburg, P.F., Agee, J.K., & Franklin, J.F. (2005). Dry forests and wildland fires of the inland Northwest USA: Contrasting the landscape ecology of the pre-settlement and modem eras. Forest Ecology and Management, 211, 117-139. doi: l0.1016/j.foreco.2005.02.0

Holthaus, E. (2017). The firestorm ravaging northern california cities, explained. Retrieved from http://www.motherjones.com/environment/2017/10/the-firestorm-ravaging-northern-california-cities-explained/

Houtman et al (2013). Allowing a wildfire to burn: estimating the effect on future fire suppression costs. International Journal of Wildland Fire. A-L. doi: 10.1071/WF12157

Huang, Y., Wu, S., & Kaplan, J.O (2015). Sensitivity of global wildfire occurrences to various factors in the context of global change. Atmospheric Environment, 121; 86-92; doi: 10.1016/j.atmosenv.2015.06.002

Kobziar, L.N., Goodwin, G., Taylor, Leland., & Watts, A.C. (2015). Perspectives on trends, effectiveness, and impediments to prescribed burning in the Southern U.S. Forests. (6)3, 561-580. doi: 10.3390/f6030561

Outcalt, K.W & Brockway, D.G. (2010). Structure and composition changes following restoration treatments of longleaf pine forests on the Gulf Coastal Plain of Alabama. Forest Ecology and Management, 259, 1615-1623. doi: 10.1016/j.foreco.2010.01.039

Pacific Biodiversity Institute. (2009). Benefits of fire in ecosystems. Retrieved from http://www.pacificbio.org/initiatives/fire/fire_ecology.html

Pacific Northwest Research Station (2015, September 14). Fuel treatments: thinning and prescribed burns. Retrieved from https://www.fs.fed.us/pnw/research/fire/fuel-treatments.shtml

Schoennagel et al, (2017). Adapt to more wildfire in western north american forests as climate changes. Proceedings of the National Academy of Sciences of the United States of America, 114(18), 4582-4590. doi: 10.1073/pnas.1617464114

Stephens et al. (2012). Effects of forest fuel-reduction treatments in the United States. Bioscience, 62, 549-560. Doi: 10.1525/bio.2012.62.6.6

Snyder, M. (2014, July 2). What is a forest stand and why do foresters seem so stuck on them. Retrieved from https://northernwoodlands.org/articles/article/forest-stand

United States Geological Survey. (1999, September 22). USGS studies wildfire ecology in the Western United States. ScienceDaily. Retrieved from www.sciencedaily.com/releases/1999/09/990922050418.htm

Washington, G.W. Fire and fuels management: Fire and fuels management: Definitions, ambiguous terminology and references. Retrieved from https://www.nps.gov/olym/learn/management/upload/fire-wildfire-definitions-2.pdf

Westervelt, E. (2017, October 14). In Northern California, exhausted firefighters push themselves ‘to the limits’. Retrieved from https://www.npr.org/sections/thetwo-way/2017/10/14/557620863/exhausted-firefighters-make-progress-against-northern-california-wildfires?utm_campaign=storyshare&utm_source=facebook.com&utm_medium=social

Creating A solution For Asian Carp

 For hundreds of years, the fishing industry has not only supported millions of Americans livelihood, but has also become an immense avenue of trade and commerce across domestic and foreign borders. Invasive species threaten this avenue and are estimated to cause the United States tens of billions in environmental and economic damage each year they remain in U.S. waters (Pasko & Goldberg, 2014). An invasive species is defined as a non-native species in an ecosystem whose introduction will likely cause environmental harm (National Invasive Species Information Center, 2006). Aquaculturists introduced the invasive Asian carp to the United States in 1970 for the sole purpose of controlling algae blooms in aquaculture ponds. Algae blooms are an increase in algae and green plants, that may carry toxins, due to an excess amount of nutrients in the water that deplete the amount of oxygen resulting in the death of fish (Environmental Protection Agency [EPA], 2017). Since Asian carp feed on algae, aquaculturists believed they were the perfect solution to controlling their algae bloom issue. This worked until 1980, when flooding led to Asian carp (i.e. bighead carp, silver carp, grass carp, and black carp) escaping their aquaculture ponds and spreading into local water bodies, introducing them into the Mississippi River, Ohio River, and some of it tributaries. Once the Asian carp population settled into the surrounding bodies of water, they started to outcompete native fish by appropriating their resources. To resolve the detrimental Asian carp issue, it is essential for humans to fulfill the role of their natural predators by creating a profitable fishing market to reduce their population in U.S. ecosystems.

Asian Carp are an extremely dangerous fish for the ecosystem. The presence of Asian Carp in the Ohio River led to a population crash of Gizzard Shad, a dominant planktivore species (aquatic organisms that feed on plankton such as zooplankton) in the early 1990s (Pyron et al., 2017). Gizzard shad are small fish in the herring family that feed on these planktivore species. The Asian carp consume up to 40% of their body weight in planktivores each day, leading to a decreased amount of  food supply for Gizzard shad, which led to a decrease in their populations (Pyron et al., 2017). A clear over population of carp is present and something must be done. In 1997, fishermen reported catching over 50,000kg of carp compared to the previous catch size of 5,000kg (Chick and Pegg, 2001). Although Asian Carp are only one of 139 species in Lake Erie, they are quickly taking over space and resources, resulting in the native species becoming extinct in those specific areas (Simon et al., 2016). If time continues without a decline in population of Asian carp, it is clear that the native species will continue to decrease. If native fish continue to decrease in the Mississippi River, it will hurt the fisheries and the ecosystem because carp are effectively killing off native species due to competition for resources. The amount of taxpayers money it would take to rebuild the ecosystem is unthinkable. The jobs and money lost will be in the millions. At the end of the day, Asian carp are taking over many of the major U.S. rivers, which can be more devastating than one can imagine.  

In the river economies, commercial fisheries are essential to efforts of reducing the population of Asian carp. U.S. fisheries provide $208 billion in sales, contribute $97 billion to the nations GDP (Gross Domestic Product) and provide 1.6 million people with jobs (NOAA, 2017). To operate a healthy fishery, there must be a balance between predator and prey (Minnesota Sea Grant, 2017).  In  the U. S., Asian carp have very few natural predators, allowing them to out-compete native fish species, resulting in a reduction of those native fish populations (Minnesota Sea Grant, 2017). The decline of native fish populations negatively affects fisheries because it becomes harder and more expensive to raise and sell those fish, resulting in the closing of fisheries (Louisiana Wildlife & Fisheries, 2015). To prevent commercial fisheries from shutting down, the demand of Asian carp needs to increase. Only when demand is increased, will the process of lowering carp populations rise.

The best way to control an invasive species is to create a mechanism to prevent further introduction, create systems to monitor and detect new infestations, and to move rapidly to eradicate invaders (National Wildlife Federation, 2017). Once an invasive species establishes itself, it becomes extremely difficult and expensive to control. Lionfish are native to the Indo-Pacific, and are found invading the east coast of the US, the Caribbean, and the Gulf of Mexico (NOAA, 2017). Like Asian carp, Lionfish have very few predators due to the fact that they are non-native to the U.S. However, the U.S. combated the invasive lionfish by distributing permits for their removal to recreational divers (Florida Fish and Wildlife Conservation Commission, 2017). Permits to catch lionfish allow one to use spear fishing methods; no permit is required for the removal of lionfish with the use of hook and line (Florida Fish and Wildlife Conservation Commission, 2017). After the Lionfish are caught, they are used as a food source for people (Lionfish Hunting, 2017). Eating lionfish is good for the environment because removing them helps reefs and native fish populations recover from environmental pressures, lionfish predation, and overfishing (Lionfish Hunting, 2017). Lionfish and Asian carp are both invasive species in the U.S., and they both became successful by their ability to reproduce rapidly, outcompete native species for food and habitat, and avoid predation (NOAA, 2017). Therefore, we can confidently say that using a solution similar to what was used with Lionfish, will give us the results we are looking for with Asian carp. Asian carp have negative effects on the ecosystems they invade, but by using Lionfish as a base model, we will be able to combat the overpopulation of Asian carp by increased fishing.

Many communities rely on fishing as a source of income and food. Asian carp lack natural predators as a consequence of their rapid reproduction, which results in an absence of natural predation to bring down their population. Fortunately, Asian carp mature rapidly and reach a harvestable size at a young age (Michigan Department of Natural Resources [MDNR], 2017). Commercial fishers and markets can benefit from this rapid population increase of Asian carp because it provides an opportunity to create a market. Since commercial fishers rely on large numbers of fish, the higher the population of Asian carp, the more they are able to catch and sell them. In the U.S., humans are the main predators of Asian carp, resulting in the removal of more than 750,000 kg of bighead carp from the Illinois River over a four year period (Ridgway & Bettoli, 2017, p. 438). Asian carp can create plentiful commercial fishing jobs and increase demand with the establishment of a proper marketing strategy.

To eliminate the over population of Asian carp, we need to create a market that increases the demand of Asian carp. Once the demand of Asian carp increases, hunting pressure will also increase. Private industries are actively developing products and markets that utilize Asian carp in a high volume to keep up with increased fishing (Pasko & Goldberg, 2014). One of the main ways Asian Carp are used after they are caught is in food dishes (Illinois Department of Natural Resources [IDNR], 2017). In addition, Carp are commonly turned into kosher hot dogs, fish jerky and omega-3 oil supplements (Modern Farmer, 2015). The community of Chicago was given an opportunity to sample the healthy and tasty fish free of charge, while teaching them about efforts to protect the Great Lakes from the invasive Asian carp (IDNR, 2017). We aim to eliminate the negative perception of Asian carp through public exposure and outreach to promote it as a quality food item in domestic and international markets.

Asian carp have the potential to invade the Great Lakes if no action is taken towards decreasing their population. Bighead and Silver carp eat 5-40 percent of their body weight each day (Asian Carp Response in the Midwest, 2017). They are filter-feeders, meaning they consume plankton, algae, and other microscopic organisms. Native fish populations rely on the same plankton as their main source of food during their larval stage. If Bighead and Silver carp populations increase they can wipe out the larval population of native fish by striping away their key sources of nourishment at the vulnerable larval stage (New York Invasive Species Information [NYISI], 2011). If Asian carp spread to the Great Lakes, they will negatively affect the $7 billion/year fishing industry by out-competing native fish species for food and habitat.

If Grass carp were to spread into the Great Lakes, they will cause degradation of the water quality and damage to wetland vegetation by consuming aquatic plants (NYISI, 2011). Their foraging disturbs lakes and river bottoms, destroys wetlands, and increases murkiness in the water, making it more difficult for native fish to find food. The destruction and loss of aquatic vegetation also leaves native juvenile fish without proper cover from predators and reduces spawning habitats (Fisheries and Oceans Canada [FOC], 2017).

Once Black carp reach the Great Lakes, they will cause a decline in the native mussel population (Michigan Invasive Species [MIS], 2017). Black carp consume native mussels and snails posing an immediate threat to the Great Lakes ecosystem (MIS, 2017). Many of the native mussels are already considered an endangered species and the introduction of Black carp would only make it worse (MIS, 2017). A severe decline in the mussel population would be a huge problem for the Great Lakes. The decline of mussels will negatively affect the water quality because mussels act as biological filters that keep the water clean and healthy (State Of The Great Lakes, 2005). Mussels are also eaten by other animals, such as fish, otters, and birds. The decline of mussels in the Great Lakes mean less food for its predators, potentially resulting in a decline in those animals as well (State Of The Great Lakes, 2005). Although mussels may seem to be a insignificant animals, they are extremely important to the Great Lake’s ecosystem in many ways (State Of The Great Lakes, 2005). The decline in mussel population would result in a decline in water quality (mussels are filter feeders), as well as a decline in other native species’ populations who already depend on them for food (State Of The Great Lakes, 2005).

While the market for Asian carp is strong internationally, there has been some resistance in the U.S. due to the fact that Asian carp are looked at negatively as bottom feeders by society (Varble and Secchi, 2013). One way that markets have started to overcome this resistance is by simply referring to Asian carp as “silverfin”. The University of Arkansas conducted a blind taste test between canned tuna, salmon, and carp, this resulted in canned carp being rated better than both tuna and salmon (Varble and Secchi, 2013). This supports the theory that most of the resistants in the U.S. is due to the fact that society views Asian carp negatively (Varble and Secchi, 2013). If Asian carp markets start referring to them as “silverfin” there could be less resistance to the consumption of Asian carp because it would look  more appealing to the public (Varble and Secchi, 2013). Other countries have utilized the fact that Asian carp reproduce with large amounts of eggs as another avenue of profit (Varble and Secchi, 2013). The collection of carp eggs has become a growing part of the caviar market but has yet to be utilized in the U.S. (Varble and Secchi, 2013).

The market price of Asian carp is very low because of its current abundance in U.S. waterways (Varble and Secchi, 2013). People believe that the quality of meat Asian carp provides is low because the price to purchase it is also low (Varble & Secchi, 2013). If communities are made aware of the quality and palatability of Asian carp, the demand for them would increase in local markets (Varble & Secchi, 2013). Many communities pride themselves on local food production and consumption, which could be a valuable asset in marketing the carp. Local production of Asian carp can be paired with the negative environmental impacts they cause to help increase consumption of Asian carp in communities surrounding areas inhabited by Asian carp (Varble & Secchi, 2013).

The local and commercial fishing industries are an extremely important part of the United States environmental and economic well-being. Invasive Asian Carp are a key factor to a massive native fish decline in the Mississippi River (Asian Carp Response in the Midwest, 2017). Without fish, people would lose not only a food source, but a source of income and a way to keep rivers and lakes clean. Asian carp are a type of fish that are very good at hunting prey and can reproduce quickly, making it essential to create a population decline in order to protect the natural ecosystem. Creating a consumer market for carp will not only solve the problem of overpopulation, it will also be beneficial for our economy and our environment. As of recently, various fisheries all over the country have suffered due to these carp spreading into more and more waterways (NOAA, 2017). Since fisheries are a billion dollar industry, Asian carp are essentially creating an economic problem (NOAA, 2017). To reduce the current population, fishermen first need to fish out a majority of the carp, which they will then sell to local businesses and vendors. Once the fish is purchased by these businesses and vendors, they can sell the fish in the public market, making two branches of this economic sector profit, therefore boosting the economy. In turn, the Carp population due to increased demand will eventually become extremely low, allowing the native fish populations to become established once again. The native fish could then start to rebalance the natural food web again, keeping the rivers healthy.  If Asian carp are only minimally hunted, there is serious risk of the health of all native species in the Mississippi river as well as the river itself. Asian Carp are clearly a very successful yet detrimental, invasive species to the United States. However, their success may lead to their demise. If we can create a high demand market for carp, utilizing humans as their natural predator, we can restore the river environments that have been harmed, while creating jobs and food for people.

AUTHORS

Tiffany Vera Tudela- Natural Resource Conservation

James Sullivan- Natural Resource Conservation

Shannon Gregoire- Animal science

Dylan Osgood- Building Construction Technology


REFERENCES

ASIAN CARP CREATING PROBLEMS IN LOUISIANA WATERWAYS. (n.d.). Retrieved December 04, 2017, from http://www.wlf.louisiana.gov/news/30510

Asian carp response in the midwest. (2017). Asian Carp Frequently Asked Questions. Retrieved from http://www.asiancarp.us/faq.htm

Chick, J. and Pegg, M. (2001). Invasive carp in the Mississippi river basin. Science 292(5525), 2250-2251. doi:10.1126/science.292.5525.2250

Environmental Protection Agency. (2017). Nutrient Pollution. Washington, D.C.

Fisheries and Oceans Canada. (2017). Asian Carp. Retrieved from http://www.dfo-mpo.gc.ca/science/environmental-environnement/ais-eae/species/asian-carp-fact-sheet-eng.html

Fisheries, N. (2017, May 09). NOAA Fisheries Releases Fisheries Economics of the U.S. and Status of Stocks Reports. Retrieved December 04, 2017, from http://www.nmfs.noaa.gov/stories/2017/04/05_feus_sos_reports.html

Florida Fish and Wildlife Conservation Commission. (2017). Lionfish Recreational Regulations. Florida.

Illinois Department of Natural Resources. (2017). Target Hunger Now! Program Features Asian Carp. Chicago, Illinois.

Invasive species. (April 27, 2006). In National Agricultural Library online. Retrieved from https://www.invasivespeciesinfo.gov/whatis.shtml


Lionfish Hunting. (2017). Eating Lionfish. Retrieved from https://lionfish.co/eating-lionfish/

Louisiana Wildlife & Fisheries. (2015). Asian Carp Creating Problems In Louisiana Waterways. Baton Rouge, Louisiana.

Michigan Department of Natural resources. (2017). Invasive Carp. Michigan.

Minnesota Sea Grant. (2017). Aquatic Invasive Species. Retrieved from http://www.seagrant.umn.edu/ais/

National Oceanic and Atmospheric Administration. (2017). What is a Red Tide.

National Park Service. (2017). Asian Carp Overview. Mississippi.

National Wildlife Federation. (2017). Stopping Asian Carp. Reston, Virginia.

New York Invasive Species Information. (2011). Asian Carp. Retrieved from http://www.nyis.info/index.php?action=invasive_detail&id=29

Pasko, S. and Goldberg, J. (2014). Review of harvest incentives to control invasive species. Management of Biological Invasions 5(3), 263-277. doi: http://dx.doi.org/10.3391/mbi.2014.5.3.10

Pyron, M., Becker, J. C., Broadway, K. J., Etchison, L., Minder, M., Decolibus, D., & Murry, B. A. (2017). Are long-term fish assemblage changes in a large US river related to the Asian Carp invasion? Test of the hostile take-over and opportunistic dispersal hypotheses. Aquatic Sciences, 79(3), 631-642. Doi:10.1007/s00027-017-0525-4


Ruffe: A New Threat to Our Fisheries. (n.d.). Retrieved December 04, 2017, from http://www.seagrant.umn.edu/ais/ruffe_threat

Simon, T. P., Boucher, C., Alfater, D., Mishne, D., & Zimmerman, B. (2016). An Annotated List of the Fishes of the Western Basin of Lake Erie with Emphasis on the Bass Islands and Adjacent Tributaries. The Ohio Journal of Science. 116(2), 36-47. Doi: 1874392640.


Varble, S., & Secchi, S. (2013). Human consumption as an invasive species management strategy. A preliminary assessment of the marketing potential of invasive Asian carp in the US. Appetite, 65, 58-67. doi:10.1016/j.appet.2013.01.022

What We Do to Stop Invasive Species. Retrieved December 04, 2017, from https://kids.nwf.org/Home/What-We-Do/Protect-Wildlife/Invasive-Species.aspx

Micro Irrigation: How to Make Every Drop Count


Mike Wissemann is a tenth generation farmer from Sunderland, MA. His farm, Warner Farm, has been an established source of crops for the surrounding towns since 1718. Mr. Wisseman inherited three hundred years of farming techniques and tricks. He spent his high school years working on the family farm and went on to receive a degree in Plant and Soil Science from the University of Massachusetts Amherst. Mr. Wisseman successfully expanded the farm and his crops from potato/onion crop to a wide variety of fruits and vegetables (Schwarzenbach, 2017). However, no amount of experience or education stopped him from losing tens of thousands of dollars when the Northeast experienced one of its worst droughts in decades (Kaufman, 2016). Farmers all over the Northeast were left scrambling to find enough water for their crops–some were even reduced to bucket brigades to get enough water to their acres of farmland (Shea, 2016).

Despite their best efforts, farmers could not plant their second round of crops. Even generally fertile farm areas such as those by rivers had major problems trying to irrigate (Schwarzenbach, 2017). When your entire livelihood depends on a natural resources (such as water), climate change and increasing drought years are a direct danger to your livelihood.

As climate change continues, droughts like the one experienced by Mr. Wissemann, are going to become more common.  Rising temperatures associated with climate change have impacted approximately 80% of monthly heat records (Coumou, Robinson, & Rahmstorf, 2013). As a rule, as temperature increases, the rate at which an organism produces energy increases as well (Hansen, Smith, & Criddle, 1998). This would be beneficial to productivity, if increased temperatures did not have the additional effect of decreasing the amounts of water available in soil. Think about the application of heat to a pot of water; when the water boils, the water escapes the pot in the form of vapor into the air. The same process holds true when heat is applied to the ground; the water escapes the soil in the form of vapor. This process leaves the soil devoid of water for the plants and leads to drought. The U.S. is a top exporter of agricultural goods and climate change is going to have a significant impact on our agriculture (Joint Economic Committee Democratic Staff, 2012). Between 2000 and 2015, 20-70% of the United States experienced abnormally dry conditions each year (Environmental Protection Agency [EPA], 2016). This does not bode well for the agricultural industry as droughts have an intensely negative impact on crops.

Decreased soil moisture means less water is available for the plants. This both leads to water stress and exacerbates heat stress. Water stress is a variety of plant symptoms that negatively affect plant productivity. It also aggravates heat stress which is when a plant suffers significant tissue damage because of high temperatures or high soil temperatures (Hall, 2017). The same way that humans expect to catch a cold from being overly cold or hungry for too long, plants are more susceptible to disease after being dehydrated and overheated for too long. When leaves of corn are subjected to drought-like conditions, they contained 69% more diseased biomass (Vaughan et al., 2016). When a plant is dehydrated, tiny openings in the leaves close to avoid further loss of water through evaporation. When these openings close, the leaf is incapable of expelling oxygen and taking in carbon dioxide–as if the plant is holding its breath (Osakabe, Osakabe, Shinozaki, & Tran, 2014). Increased heat stress and decreased water availability reduces the plant ability to breathe and thus make food. This results in a weakened plant that is more susceptible to disease (Irmak, 2016; Vaughan et al., 2016).

To get a better sense of the effects of combining heat and water stress, these processes can be related to the human body. Heat stress is similar to running; it elevates your heart rate.  If you run forever without rest, you will pass out, and most likely die without medical attention. Water stress, which is like holding your breath, will also eventually kill you, but can be done for some length of time. When heat stress and water stress occur simultaneously, it is like running a marathon while holding your breath. Such a venture would result in near-immediate loss of consciousness, and death without medical attention. Similarly, a plant under both water and heat stress, sees a drastic decrease in productivity, and eventual death without a change in conditions.

We are exceptionally vulnerable to these effects of climate change on our crops due to our current method of water usage. Current estimates reveal that 70% of freshwater withdrawals go towards irrigation uses (Block, 2017) and a large amount of this water could be conserved. A widely accepted, but inefficient method of irrigation is furrow or gravity irrigation. It accounts for 35% to 42% of irrigation systems in the United States (Subbs, 2016). Compared to a more modern technique known as drip irrigation, it wastes 43.6 % of total water use (Tagar et al., 2012,  p. 792). Furrow irrigation involves planting crops in rows with small trenches running in between them. Water is then flown down the trenches that run alongside the crops (Perlman, 2016). Farmers across the nation use furrow irrigation because there are lower initial investment costs as well as a lower cost for pumping water (Yonts, Eisenhauer, & Varner, 2007). Unfortunately, it also wastes a lot of water. The water is not targeted on the roots and much of it goes to wetting soil around the plant and not the actual root. This is inefficient because the roots are the plant structure that absorb the water (Lamont, Orzolek, Harper, Kime, & Jarrett, 2017). The water that is not on the roots is more likely to be lost as soil evaporation which accounts for over 50% water lost in furrow irrigation (Batchelor, Lovell, & Murata, 1996). Traditional forms of irrigation irrigate the entire field, wasting precious water on soil that will not be in contact with the plant’s roots (Lamont et al., 2017).

Plants need fresh water to survive but, unfortunately, water is a finite resource. Although the water covers 70% of the planet, only 2.5% of it is fresh water. This freshwater is “stored” in places like rivers, lakes, ice, and, perhaps most importantly, in the ground. Surface water seeps down through layers of dirt and rock to recharge groundwater storage areas, more commonly known as aquifers. Aquifers are made up of types of rock particles, such as sand and gravel,  that have enough space between them that the water can happily live. We need freshwater for activities ranging from drinking to manufacturing processes to agricultural irrigation. And about 50% of the freshwater we use for these activities is derived from groundwater (Dimick, 2014).  

The main differing factor between groundwater and surface water as a source of fresh water is the time it takes for these reserves to be recharged. Surface waters, such as lakes, can be replenished with seasonal rains. Groundwater on the other hand can take anywhere from months to tens of thousands of years to build up a reserve because the water has to flow through layers and layers of soil and rock to reach the aquifer. It can also be left untouched for long periods of time as it is not susceptible to the same rules of constant evaporation as surface water.

Agriculture has been using up this resource far faster than it can be replaced. It may take years to build up a water reserve, but it only takes seconds to pump it out. For example, the Ogallala Aquifer, which is located under the Great Plains of the United States, recharges at a rate of less than 1 inch per year (Kromm, 2017). However, over the past decade water has been withdrawn at a rate of approximately 18 inches per year. It is estimated that in the next 50 years, 69% of the Ogallala Aquifer will be gone. This depletion of groundwater resources is happening all over the country from the Colorado River Basin to the California Central Valley to the North China Plain to the Middle East (Dimick, 2014).

We cannot fix climate change, however we can mitigate its effects through effective water usage. Using the method of Micro Irrigation also known as drip irrigation, we can conserve water and mitigate the negative effects of water and heat stress on crops. Micro Irrigation involves using pressurized piping that drips water directly on the roots of the plant. It consists of a mainline distribution, sub-mainline (header), drip lines, filters, pressure regulators, and chemical injectors. Laying down an underground network of pipe which has an opening at the base of each plant. Using a pressurizing system to efficiently deliver water directly to the root system of the plant, which is the part that absorbs water (Lamont et al., 2017).

This decreases the water stress on the plants because it ensures that the plants are receiving enough water. Adequate water leads to healthier and more disease resistant crops (Irmak, 2016; Vaughan et al., 2016).

Not only does this method create better living conditions for the plants, it also conserves an incredible amount of water. This will be especially key as water availability decreases with climate change. Drip irrigation improves efficiency of water on farms by reducing the soil evaporation and drainage losses. In terms of conservation, drip irrigation may require less than half the water needed in a sprinkler irrigation method (Lamont et al., 2017). Since the water is applied directly to the roots, no water is wasted on non-productive areas, resulting in even more water efficiency (Lamont et al., 2017). Drip irrigation was much more efficient than furrow irrigation saving 56.4% of the water in comparison. (Tagar et al., 2012,  p. 792).

However, traditional irrigation wastes water in a way that drip irrigation does not. In terms of the framework of increasing water demand with climate change, agricultural methods that recognize water as a valuable, finite resource need to be implemented.  

Furrow Irrigation is cheaper to install initially, but is far more water and energy inefficient compared to drip irrigation. To install, depending on the type of furrow irrigation and the size of the farm, it will be anywhere from $13 to $70 per acre (Wichelns, Houston, Cone, Zhu, Wilen, 1996). There are more repair costs and maintenance costs for this particular type of irrigation and can be anywhere from $13 to $90 annually per acre (Wilchens et al., 1996). While it is cheaper initially, drip irrigation uses water and energy so much more efficiently, that the long term savings of drip irrigation far outweigh the initial cheapness of the furrow irrigation.

Drip Irrigation costs approximately $500- $1,200 per acre, or potentially more, to install (Simonne et al., 2015). For reference, Louisiana Delta Plantation has over 26,000 acres (Honey Brake Lodge, 2017). An acre is about the size of a football field, which would make that farm the size of 26,000 football fields put together. Even at the lowest cost, converting to Drip Irrigation would cost approximately $13 million for the Louisiana Delta Plantation. Even though the initial investment is hard to grasp in terms of magnitude, eventually the system will pay for itself by maintaining crop yields, even in dry years, and lowering energy and water costs (Stauffer, 2010; Lee Engineering, 2017). How much money will be saved and how many years it will take for the new system to pay for itself is largely dependent on the size of the farm and what kind of crop is being grown, therefore, there are not any specific numbers because of the huge variability of farm types and sizes (Stauffer, 2010). In addition, climate change is very difficult to predict precisely enough for long-term cost analysis, and the type of year-to-year predictions necessary to make those calculations are not presently feasible.

Additionally, the drip method is actually shown to increase crop yields by 22%, which itself is motivation for its implementation (Tagar et al., 2012,  p. 792). California almond farmers have seen their crop yields double as they increased their reliance on the micro irrigation system (Block, 2017). Drip irrigation creates better growing conditions by maintaining the correct moisture conditions favorable for crop growth (Batchelor et al., 1996).

However, if the initial investment cost is offset, micro irrigation will save money in the long run. This method of subsidizing the initial cost has been successful in other situations such as in the case of solar panels. An initial investment cost for switching to solar energy can be anywhere between $10,000 and $50,000 (Maehlum, 2014). It would be reduced by thousands of dollars because of the Federal and state tax credits associated with switching to solar power. Eventually, the solar panels will pay for themselves and even save you money in the long term, much like drip irrigation. Largely dependent on how big the house is, how much power is used, and where the house is located, the payback time for switching can vary, but for an average household with a high regular energy cost would be able to payback the initial investment in as little as 15 years (Maehlum, 2014).

A potential source of funding for this initial cost is the federal government. In a recent publication, the United States Department of Agriculture (USDA) showed that they are willing to fund such advancements in the agricultural industry in the name of invasive species, habitat management, soil erosion, and generalized conservation. Since all these factors contribute to the overall health and wellbeing of a farm, efficient watering is logically a top priority for the government.

These programs fall under The Conservation Reserve Program (CRP) which is a program offered by the USDA Farm Service Agency. The CRP is offered as part of an overall program to address invasive species research, technical assistance, and prevention and control that was set up by the USDA in 2015 (United States Department of Agriculture [USDA], 2015). The CRP specifically is a grant based program where the government is willing to supply money to farmers “for establishment of resource-conserving cover on environmentally sensitive croplands.” (USDA, 2015, p. 4). Among other programs, the Environmental Quality Incentive Program, which gives government aid to farmers who want to use more efficient and conservation friendly tools, and the Conservation Technical Assistance Program, which awards tools for conservation to private, tribal, and non federal lands, show a clear willingness for the government to aid in funding programs geared toward conservation and climate change problems (United States Department of Agriculture, 2015). The method under discussion to more efficiently water our farmland is expensive, but clearly the government is willing and able to encourage and fund conservation of farmlands in whatever way possible, even if that means switching to a more efficient water usage irrigation system.

Currently, despite its ability to conserve water, increase crop yields, and mitigate climate change impacts, the use of micro irrigation is not widespread. This is due in part to its high initial investment cost. With grants from the government to offset the initial costs, the system will eventually save money in the long term. A livelihood for farmers like Mike Wissemann, and food for the public like you, are only going to worsen as temperatures continue to rise. Water efficiency is important now more than ever before.

AUTHORS

Jeremy Brownholtz – Environmental Science

Molly Craft – Natural Resource Conservation

Noah Rak – Building and Construction Technology

Mary Lagunowich – Earth System


REFERENCES

Batchelor, C., Lovell, C., & Murata, M. (1996). Simple microirrigation techniques for improving irrigation efficiency on vegetable gardens. Agricultural Water Management,32(1), 37-48. doi:10.1016/s0378-3774(96)01257-7

Block, Ben. (2017). “Efficient” Irrigation Tool May Deplete More Water. Retrieved from http://www.worldwatch.org/node/5942.

Coumou, D., Robinson, A., & Rahmstorf, S. (2013). Global increase in record-breaking monthly-mean temperatures. Climatic Change,118(3-4), 771-782.

Dimick, D. (2014, August 21). If You Think the Water Crisis Can’t Get Worse, Wait Until the Aquifers Are Drained. Retrieved from https://news.nationalgeographic.com/news/2014/08/140819-groundwater-california-drought-aquifers-hidden-crisis/

Environmental Protection Agency [EPA]. (2016). Climate Change Indicators. Retrieved from https://www.epa.gov/climate-indicators/climate-change-indicators-drought

Hall, A. E. (2017). Heat Stress and its Impact. Retrieved from http://www.plantstress.com/Articles/heat_i/heat_i.htm

Hansen, L.D., Smith, B.N., & Criddle, R.S. (1998). Calorimetry of plant metabolism: A means to rapidly increase agricultural biomass production. Pure & Applied Chemistry, 70(3).

Honey Brake Lodge. (2017). Louisiana Delta Plantation: About. Retrieved from https://www.honeybrake.com/la-delta-plantation

Irmak, Suat. (2016) Impacts of extreme heat stress and increased soil temperature on plant growth and development. Retrieved from https://cropwatch.unl.edu/2016/impacts-extreme-heat-stress-and-increased-soil-temperature-plant-growth-and-development.

Joint Economic Committee Democratic Staff [JECDS]. (2012). The economic contribution of America’s farmers and the importance of agricultural exports. Washington, DC: U.S. Congress. Retrieved from https://www.jec.senate.gov/public/_cache/files/266a0bf3-5142-4545-b806-ef9fd78b9c2f/jec-agriculture-report.pdf.

Kaufman, Jill. (2016, August 16). Northeast Farmers Grapple with the Worst Drought in Over A Decade. Retrieved from https://www.npr.org/sections/thesalt/2016/08/30/491942025/northeast-farmers-grapple-with-worst-drought-in-more-than-a-decade.

Kromm, David. (2017). Water Encyclopedia: Science & Issue. Retrieved from http://www.waterencyclopedia.com/Oc-Po/Ogallala-Aquifer.html

Lee Engineering. (2017, July 31). 6 Reasons Why Drip Irrigation Pays For Itself. Retrieved from http://lee-engineering.com/irrigation/6-reasons-drip-irrigation-pays/

Lamont, W. J., Orzolek, M. D., Harper, J. K., Kime, L. F., & Jarrett, A. R. (2017, November 2). Drip Irrigation for Vegetable Production. Retrieved from https://extension.psu.edu/drip-irrigation-for-vegetable-production

Maehlum, M. A. (2014, July 18). How Long to Pay Off my Solar Panels? Retrieved from http://energyinformative.org/long-pay-solar-panels/

Osakabe, Y., Osakabe, K., Shinozaki, K., & Tran, L.-S. P. (2014). Response of plants to water stress. Frontiers in Plant Science, 5(86). http://doi.org/10.3389/fpls.2014.00086

Perlman, U. H. (2016, December 9). Irrigation Water Use: Surface irrigation. Retrieved from https://water.usgs.gov/edu/irfurrow.html

Schwarzenbach, V. (2017). Our Story. Retrieved from http://www.warnerfarm.com/our-story/

Shea, Andrea. (2016, August 6). Severe Drought Hits Majority of Massachusetts. Retrieved from https://www.npr.org/2016/08/06/488969852/severe-drought-hits-majority-of-massachussetts.

Simonne E., Hochmuth R., Breman J., Lamont W., Treadwell D., & Gazula A. (2015, October 29). Drip-irrigation Systems for Small Conventional Vegetable Farms and Organic Vegetable Farms. Retrieved from http://edis.ifas.ufl.edu/hs388

Stauffer, B. (2010). Drip Irrigation. Retrieved from https://www.sswm.info/category/implementation-tools/water-use/hardware/optimisation-water-use-agriculture/drip-irrigation

Tagar, A., Chandio, A., Mari, I.A., & Wagan, B. (2012). Comparative study of drip and furrow irrigation methods at farmer’s field in umarkot. World Academy of Science, Engineering and Technology 69, 788-792. Retreived from https://www.researchgate.net/profile/Farman_Ali_Chandio/publication/259346633_Comparative_Study_of_Drip_and_Furrow_Irrigation_Methods_at_Farmer’s_Field_in_Umarkot/links/00b4952b261f3be0ac000000.pdf

Thomson, A.M., Rosenberg, N.J., Izaurralde, R.C., Brown, R.A., & Benson, V., (2012). Climate change impacts on the conterminous USA: An integrated assessment. Part 3. Dryland production of grain and forage crops. Climatic Change, 69(1), 43-65. doi:10.1007/s10584-005-3612-9

United States Department of Agriculture [USDA]. (2015). U.S. Department of Agriculture (USDA) Grant and Partnership Programs that can Address Invasive Species Research, Technical Assistance, Prevention and Control. Washington DC. Retrieved from https://www.doi.gov/sites/doi.gov/files/uploads/USDA%20Grants%20Workbook%20FY%202016%20FINAL%2016%20Oct%202015.pdf

Vaughan, M,. Huffaker, A., Schmelz, E., Dafoe, N., Christensen, S., McAuslane, H., Alborn, H., Allen, L.H., Teal, P.E.A. (2016) Interactive effects of elevated [CO2] and drought on the maize phytochemical defense response against mycotoxigenic Fusarium verticillioides. PloS One. 11(7). doi: 10.1371/journal.pone.0159270

Wichelns D, Houston L, Cone D, Zhu Q, Wilen J. 1996. Farmers describe irrigation costs, benefits: Labor costs may offset water savings of sprinkler systems. Calif Agr 50(1):11-18. https://doi.org/10.3733/ca.v050n01p11.

Yonts, C., Eisenhauer, E., & Varner, D. (2007, June). Managing Furrow Irrigation Systems. Retrieved from http://extensionpublications.unl.edu/assets/html/g1338/build/g1338.htm#target

Protecting Against Climate Change’s Mega-Storms


On August 24, 2017 hurricane Harvey made landfall in Texas as a category 4 hurricane. It was the first major hurricane to hit Texas since 1970 (Allen & Davis, 2017), and it was devastating. The storm delivered a year’s worth of rain in less than a week, being called the wettest tropical storm on record in the United States as affected areas received more than 40 inches of rainfall with peak accumulations of 64.58 inches in just four days (Dart & Helmore, 2017, para 3). The two main flood-control reservoirs that were supposed to protect the Houston area broke. Water levels rose dramatically, damage was increased tenfold, and hundreds of lives were lost. A storm surge of over 12 ft was reported at Aransas Wildlife Refuge, and other areas had storm surges ranging from 3-10 ft as the hurricane stalled over southeast Texas. Hurricane Harvey is the costliest hurricane to ever hit the United States, the damage is so high that it was feared that Texas will not receive enough money to rebuild within a month. Eventually congress budgeted 7.8 billion dollars for recovery efforts, which was only a small fraction of what was truly needed out of the $180 billion that Harvey cost (McWilliams & Parraga, 2017, para 5). After the hurricane, relief efforts were not only attempted by agencies and different government organizations, but also by neighbors and friends. With a disaster as devastating as Harvey, people needed each other to come together and offer relief and support.

It is apparent that climate change is altering the world around us and that hurricanes are becoming more severe as a result. Global warming is changing our oceans, causing a rise in sea surface temperatures, and sea levels, which creates more favorable conditions for intense hurricanes (Mallard, Lackmann, Aiyyer, & Hill, 2013). Hurricanes are classified by the amount of damage they inflict, which is based off of wind speeds and duration of the storm. A category 5 storm is the most severe and a category 1 storm is the least severe. (National Oceanic and Atmospheric Association [NOAA], 2017). Since it is easier for severe hurricanes to form, there has been a global decline in weaker hurricanes with a proportional increase in higher category storms by 2-11% (Holland & Bruyère, 2014, p. 623). We are already seeing the aftermath of such implications; severe hurricanes, which are often classified as a category 3, 4, or 5, cause significantly more damage as opposed to a category 1 or 2 hurricane (Abrams, 2017). A major cause of damage and life loss are the incredible storm surges that large hurricanes cause (NOAA, 2011). High storm surges have been reported in nearly all the hurricanes this past season, including Hurricane Irma, Hurricane Maria, and Hurricane Harvey (“Hurricane Irma”, 2017; “Major Hurricane Harvey”, 2017). Results of these hurricanes have included major flooding and infrastructural damage in affected areas, in many cases overwhelming hurricane defenses already in place (“Hurricane Katrina”, 2009). Hurricane Irma, which recently swept through Florida and the Caribbean, was the first category 5 hurricane to strike the Leeward Islands of Puerto Rico, and is said to be the most intense hurricane to hit the United States since Hurricane Katrina (“Hurricane Irma”, 2017). Just two weeks later hurricane Maria, the tenth most intense hurricane on record swept through Puerto Rico and the Dominican Republic causing catastrophic damage and sending Puerto Rico into a state of emergency (NOAA, 2017). During this past hurricane season, there have been eight big hurricanes which is double the yearly average (Rice, 2017, para 4). Three category 4 and 5 hurricanes have hit the United States in 2017, inflicting severe flooding, which is a first in hurricane history. This trend of bigger, more damaging hurricanes can not be ignored. The current barriers in place are no longer a reliable defence against the greater intensity of these storms.      

Despite the evidence, climate science is still disputed and claims no connection between climate change or its effect on sea surface temperature that ultimately affects hurricane intensity. Nevertheless, the scientific community has reached consensus and agrees that the planet is warming due to climate change (Wang et al., 2016), and that it is affecting storm strength. For each degree Celsius of global warming, there is an 11% increase in the proportion of category 4 and 5 hurricanes, but a 7% decrease in hurricanes that are category 1 and 2 (Holland & Bruye?re, 2014, p. 623). Warming sea surface temperatures have lead to more intense and violent hurricanes with larger storm surges (Kieper, n.d.) causing more and more damage each year to coastal communities in the United States (Dinan, 2017).

Natural disasters such as these are ultimately unavoidable, and there are many people who work to try to predict them in order to protect people from the damage. Anticipating hurricanes and their severity are paramount for providing effective damage and flood protection. Our effect on the climate through anthropogenic climate change has lead to an increase in hurricane intensity causing hurricanes to become bigger and last longer. Our knowledge of how global warming is affecting hurricanes can allow us to prepare more for these storms. The increase of severe, higher category storms will cause more damage than the milder hurricanes we are more accustomed to. As hurricanes intensify, there are greater costs to our economy, infrastructure, and lives (Wang, Li, Zhang, & Ellingwood, 2016; Mallard et al., 2013). There are two major types of damage caused by hurricanes: water damage and wind damage. Wind damage is caused by the high speed winds in a hurricane that can exceed 150 miles per hour which can rip trees out of the ground and move buildings (NOAA, 2017). Water damage is caused by the rain and storm surge associated with the hurricane. Flooding from these events can ruin homes, roads, coastal habitat, and even end lives. Infrastructure that was once used to hold back this storm surge is failing more often as they are overwhelmed by intense storms (Lafrance, 2015). While flood barriers won’t be able to protect communities and the landscape from wind damage, reducing the amount of water damage that will occuring during a hurricane will give people more time to protect themselves against wind damage and reduce the costs of recovering after a hurricane. For example, out of Hurricane Harvey’s 180 billion dollar bill, only 2 billion dollars of the damage was caused by wind (Wattles, 2017, para 9). It is imperative that better flood control and protection be improved and implicated to protect the people and land from severe flooding.    

As seen during hurricane Harvey, the precautions and systems in place are not enough to safely mitigate a storm. Steps that are taken in preparation include: hurricane, tropical storm, and storm surge watches, evacuation, sandbags, rescue cars and boats in case of flooding, and checks of the city’s drainage system (National Hurricane Center [NHC], 2017). No matter the preparation Hurricane Harvey breached levees and flowed over dams. In order to protect ourselves during future hurricanes and their storm surge, flood barriers, a form of levee, should be built along high risk coastlines or inlets. Areas that are at risk are cities built along the coast, which are often densely populated and at least partially below sea level. Cities that fit this criteria are Miami, Florida; New York City, New York; Tampa, Florida; and Virginia Beach, Virginia (Glink, 2013). A flood barrier is a fixed flood gate system that allows water to pass during normal conditions, but in the event of a storm or high water level, the gates are closed which stops water from passing and prevents flooding (European Climate Adaptation Program [ADAPT], 2015). These are improvements on traditional levees, which are typically artificial embankments. These structures are often placed at the mouths of inlets, rivers, or partially along certain low lying coastlines. They work by permanently installing either two gates at either side of an area, or a row of panels underneath the water. In the event of dangerous flooding, the gates swing closed through the water, creating a seal to prevent more water from entering. Or, the panels beneath the water rise, creating a wall against flood water. Flood barriers have been built in several cities throughout the world that are in high danger of flooding.

Other areas have already taken the initiative to bolster their protection against flooding. The Netherlands for example is an extremely prone country to storm surge flooding, since half the country is just one meter above sea level and more than an eighth is below sea level (Kimmelman, 2017). In 1997, the Netherlands built Maeslantkering, a storm surge barrier protecting the city of Rotterdam. At 1,600 ft long, the barrier is a modern engineering triumph capable of protecting Holland from the storm surge and rising sea levels it is so susceptible to (“Maeslantkering”, 2017; Kimmelman, 2017). The Netherlands isn’t the only country to implement this type of technology. Italy completed the Venice Mose Barriers in 2012, which also protects the low lying city from floods and sea level rise. Both countries are at risk of storm surges and have histories of major flooding, and the barriers are effective.

Levees are typically built to withstand a hundred-year flood event, which is an exceptional flood that has about a 1% chance of occurring each year. When a system is built to withstand a hundred year event, it assumes that the event will not change or get worse in that time period (United States Geological Survey [USGS], 2016). This is particularly problematic with global warming, since global warming has been rapidly changes the types of storms we experience, often making them much more severe. Therefore a hundred-year levee can easily become overwhelmed when storms that are more intense and more frequent than it was built for occur, making it essential that we build levees to more long term standards. The Netherland’s flood barrier is built to withstand a 10,000-year flood event. This makes it 100 times safer than the standards set for levees in the United States. Furthermore, since is it is built to last much longer, the Netherlands mandates that the flood control system must be upgraded accordingly to changes in frequency and intensity of flood events, so that the protection stays the same if the threat changes (McQuaid, 2012, para 8). While nothing can stop a hurricane or completely protect against them, more effective and technologically advanced systems can dramatically reduce their impact.

Upgrading our levees and flood barriers are not a foreign idea to the United States. The Army Corps of Engineers is responsible for various homeland duties such as environmental engineering, coastal fortifications, road and canal infrastructure, and disaster relief. With the Army Corps of Engineers’ generous budget and responsibility to preserving our homeland defenses against various threats, including natural ones, the U.S can fund and build select flood barriers, which has been demonstrated in Louisiana after hurricane Katrina in 2005. Hurricane Katrina created the highest storm surge in the U.S’s recorded history at 27.8 ft high (Kieper, n.d., Para 1). New Orleans, the city most devastated by the hurricane, is well below sea level. Before Katrina, it was protected from flooding only by a handful of rundown dams and levees. During the hurricane, all of these systems failed to be enough and residents had fled to rooftops to escape the water as 80% of the city became submerged. Relief was painfully slow, as the hurricane caused over $150 billion in damage and economic costs (“Hurricane Katrina”, 2009; “11 Facts About Hurricane Katrina”, n.d., para 7&8). To fortify the city against such a devastating effect again, the Army Corps of Engineers has built a flood barrier around New Orleans, which should have been in place before Katrina (Burnett, 2015). This individual flood barrier cost approximately $1.1 billion to build; while this may seem like an astronomical number, it is dwarfed by the $150 billion that the storm generated. The Louisiana coast is considered to be much safer with the flood barrier, which is considered a state entity to consolidate and provide better flood control after the hurricane (Burnett, 2015, para 4).

Some may be skeptical of the cost of investment in flood barriers as these systems are expensive and take years to complete. Furthermore, even with our current technology, we cannot guarantee complete safety. Flood protection systems have failed in the past raising questions about our ability to protect our coastal communities, and this concern comes with good reason. When Katrina made landfall in August 2005 as a category 5 hurricane, New Orleans’ levee system, which was designed by the United States Army Corps of Engineers, failed due to high wind speeds, heavy rain, and high storm surge. The city, where 50% of its residents lives below sea level, flooded taking 1,500 lives and causing $108 billion worth of property damage alone (“Hurricane Katrina Statistics Fast Facts”, 2017, para 1). However, advancement in hurricane forecasting has improved our ability to predict future storm intensity. Using this technology the United states Army Corps of Engineers have rewrote the standards used for flood barriers better preparing us for more severe storms and invested a total of $14 billion into improving and the levees and building new barriers to protect New Orleans (Burnett, 2017, para 5). Although, even with the rework of levee standards, retired Lt. General Robert Van Antwerp, the former commander of the Army Corps of Engineers said “though it would not be destroyed by another Katrina, it would most certainly be overtopped leading to many that will still be inundated” (Schleifstein, 2015, para 7). Divesting money from coastal protection should not be an option as the money is an investment in limited damages and is not intended to make our communities completely safe.
In 2015 the corps agreed that Louisiana’s levee system needed to be reevaluated by 2018. This occurred after Bob Jacobsen, who was hired to run storm surge models, found that many levees in the east bank system would fail if a 200 year storm hit, which has a .2% chance of happening in any given year. Over the next 50 years there will be $50 billion worth of projects improving New Orleans levees with risk reduction and land protection as the goal. The corps have proposed both 400 year and 1,000 year protection plans both costing $59 billion to $139 billion (Schleifstein, 2015, para 32). The corps argue that if we are going to spend the money to protect against a 100 year storm, we might as well go for the most protection possible.

Upgrades to our current flood protection systems will not be enough to protect our coastal communities. It would be most beneficial to build new flood barriers around the cities most in danger from hurricanes. An example of where there could be implemented is New York City, where flood barriers have been considered following Hurricane Sandy in 2012 (McGeehan, 2017). Hurricane Sandy caused widespread power outages, took dozens of lives, and caused billions of dollars in damage (Sharp, 2012). If a simple flood barrier were to be built protecting New York City, it would cost about $11.6 billion, and if three barriers were built along New York coast, the estimated cost is $14.7 billion (Timmer, 2014, para 8). These are costly options, yet Hurricane Sandy caused $65 billion in damage to New York (Rice & Dastagir, 2013, para 2). No matter the price tag on a flood barrier, severe hurricanes rack up a larger one. With the success of barriers in other countries and in New Orleans, barriers are a solution to protect ourselves against dangerous storms as climate change cause worse and worse hurricane events.

This past hurricane season has been swirling through the United States at unprecedented rates. The eight major hurricanes that made landfall along our coasts is double the normal average for the hurricane season (Rice, 2017). Hurricanes are being affected by rising sea surface temperatures, due to global warming. In turn, hurricanes are more intense, occurring more often. This has created a vital need for a more secure defense system against hurricanes and storm surges. In Louisiana and New York, it is agreed that adequate flood barriers would have reduced cost and life loss due to the hurricanes. If better flood barriers were to be built, then the cost could be estimated to be about $12 billion per city, referencing the costs approximated for New York. If we were to build around three cities with the highest risk, then it likely cost $36 billion. While that is a large cost, hurricane Harvey was dramatically larger at $180 billion. Building three barriers does not even equate the cost of a singular hurricane. Providing at risk areas with more effective protection against hurricanes will be undoubtedly beneficial, economically and personally. The damages that hurricanes inflict are far greater than the simple price of building and maintaining effective barriers. The lives, and money, saved are more than enough reason to build flood barriers around dangerous coastal areas.  

AUTHORS

Jennifer Beattie – Natural Resource Conservation

Juliana Berube – Natural Resource Conservation

Tyler Weeks – Building Construction Technology


REFERENCES

Abrams, A. (2017, September 19). What do hurricane categories actually mean? Time. Retrieved

from http://time.com/4946730/hurricane-categories/  

Allen K., Davis M. (2017, September 11). Hurricanes Harvey and Irma may have caused up to

$200 billion in damage, comparable to Katrina. ABC News. Retrieved from

http://abcnews.go.com/US/hurricanes-harvey-irma-cost-us-economy-290-billion/story?id=49761970

Atlas Obscura. (2017, June 21). Maeslantkering. Retrieved from

https://www.atlasobscura.com/places/maeslantkering

BBC News. (2017, September 11). Hurricane Irma. Retrieved from

http://www.bbc.com/news/business-41231323

Burnett, J. (2015, August 28). Billions spent on flood barriers, but new orleans still a

‘fishbowl’. New England Public Radio [NPR]. Retrieved from https://www.npr.org/2015/08/28/432059261/billions-spent-on-flood-barriers-but-new-orleans-still-a-fishbowl

Dart, T., Helmore, E. (2017, August 27) Hurricane Harvey claims second victim in Texas as

threat of flooding rises. The Guardian. Retrieved from

https://www.theguardian.com/us-news/2017/aug/26/texas-cities-catastrophic-flooding-hu

rricane-harvey

Dinan, T. (2017). Projected increases in hurricane damage in the United States: The role of

climate change and coastal development. Ecological Economics. 138. 186-198. 10.1016/j.ecolecon.2017.03.034.

European Climate Adaptation Program [ADAPT]. (2015).  Storm surge gates / flood barriers.

Retrieved From

http://climate-adapt.eea.europa.eu/metadata/adaptation-options/storm-surge-gates-flood-barriers

Glink, I. (2013). Top 10 cities at risk from hurricane damage. CBS News. Retrieved from

https://www.cbsnews.com/media/top-10-cities-at-risk-from-hurricane-damage/8/

History. (2009) Hurricane katrina. Retrieved from

http://www.history.com/topics/hurricane-katrina

Holland, G., Bruyère, C. (2014). Recent intense hurricane response to global climate change.

Climate Dynamics, 42(3-4), 617–627. 10.1007/s00382-013-1713-0

Kieper, M. (n.d). Katrinas storm surge. Weather Underground. Retrieved from

https://www.wunderground.com/education/Katrinas_surge_contents.asp

Kimmelman, M. (2017, June 15). The Dutch have solutions to rising seas. The world is

watching. Retrieved from The New York Times. https://www.nytimes.com/interactive/2017/06/15/world/europe/climate-change-rotterdam.html

Lafrance, A. (2015, August 31). A brief history of levees. The Atlantic. Retrieved from

https://www.theatlantic.com/technology/archive/2015/08/a-brief-history-of-levees/402119/


McGeehan, P. (2017, October 10). Making a pitch, again, for barriers to block storm surges. The

New York Times. Retrieved from https://www.nytimes.com/2017/10/10/nyregion/hurricane-sandy-storm-surge-offshore-barriers.html

McWilliams, G., Parraga M. (2017, September 3). Funding battle looms as Texas sees Harvey

damage at up to $180 billion. The Fiscal Times. Retrieved from

http://www.thefiscaltimes.com/latestnews/2017/09/03/Storm-damage-Texas-could-reach-180-billion-governor

McQuaid, J. (2013, October 30). A Dutch Solution for New York’s Storm Surge Woes? Forbes.

Retrieved from https://www.forbes.com/sites/johnmcquaid/2012/10/30/a-dutch-solution

-for-new-yorks-storm-surge-woes/#63d419b819c7

National Hurricane Center [NHC]. (2017). Tropical Depression Harvey. Retrieved from

http://www.nhc.noaa.gov/archive/2017/al09/al092017.public.012.shtml?

National Oceanic and Atmospheric Administration [NOAA]. (2017, October 10). What is a

hurricane. Retrieved from https://oceanservice.noaa.gov/facts/hurricane.html

National Oceanic and Atmospheric Administration [NOAA]. (2017, November 01). Major

hurricane Harvey – August 25-29, 2017. Retrieved from http://www.weather.gov/crp/hurricane_harvey

National Oceanic and Atmospheric Administration [NOAA]. (2011, July 05). Hurricane storm

surge. Retrieved from https://oceantoday.noaa.gov/hurricanestormsurge/

Rice, D. (2017, October 5). Not your imagination: This hurricane season has been much worse

than usual. USA Today. Retrieved from https://www.usatoday.com/story/weather/2017/10/05/not-your-imagination-hurricane-season-has-been-much-worse-than-usual/736649001/

Rice, D., Dastagir, A. (2013, October 29). One year after Sandy, 9 devastating facts. USA Today.

Retrieved from https://www.usatoday.com/story/news/nation/2013/10/29/sandy-anniversary-

facts-devastation/3305985/

Schleifstein, M. (2015, August 18). New Orleans area’s upgraded levees not enough for next

‘Katrina,’ engineers say. Retrieved from

http://www.nola.com/futureofneworleans/2015/08/new_levees_inadequate_for_next.html

Sharp, T. (2012, November 27). Superstorm Sandy: Facts about the frankenstorm. Live Science.

Retrieved from https://www.livescience.com/24380-hurricane-sandy-status-data.html

Timmer, J. (2016, May 2). Ars Technica. Want to flood-proof Manhattan? It’ll cost at least $11.6

billion. Retrieved from

https://arstechnica.com/science/2014/05/want-to-flood-proof-manhattan-itll-cost-at

-least-11-6-billion/

United States Geological Survey [USGS]. (2016). Floods: Recurrence intervals and 100-year

floods (USGS). Retrieved from https://water.usgs.gov/edu/100yearflood.html

Wang, C., Li, Q., Zhang, H., Ellingwood, B. (2016). Modeling the temporal correlation in

hurricane frequency for damage assessment of residential structures subjected to climate change. Journal of Structural Engineering, 143(5), 04016224. 10.1061/(ASCE)ST.1943-541X.0001710

Wattles, Jackie (2017, September 1).  CNN Money. Hurricane Harvey: 70% of home damage

costs aren’t covered by insurance.  Retrieved from http://money.cnn.com/2017/09/01/news/hurricane-harvey-cost-damage-homes-flood/index.html

11 facts about hurricane Katrina. (n.d). Retrieved from

https://www.dosomething.org/us/facts/11-facts-about-hurricane-katrina

Climate change results in more intense hurricanes


Susan and her entire family waded from her house in Houston Texas to a neighbor’s home on higher ground the morning that Hurricane Harvey hit in late August. Susan Magee a 44 year old wife and mother of two recounts her story of being evacuated from her home in the wake of of torrential rains.  Waking up her girls and telling them to pack three outfits each was one of the easier parts from her experience. The harder ones were leaving everything except her family, pets, and legal documents. Leaving the only place her two daughters have ever called home. The one space where she and her husband lived together. She acknowledges that her home was not the most spectacular building ever built but says that she did not “mind spending their savings on the down payment” (Holter, 2017). After the devastating results of the storm that was thought to only bring a few inches of water into their home (Holter, 2017), Susan comments that for the meantime they will be staying in a hotel, and are living off of donations and gifts from friends including her friends and more extended family. She sums up her struggle of being in need of assistance and simultaneously proud, she speaks on behalf of her family, when she said that they will not be able to “rebuild our lives without the help of other people” yet at the same time, “we can’t do everything on our own” (Holter, 2017).

The Magees’ home is only one of an estimated 100,000 houses that were affected by Hurricane Harvey this past August (Fessler, 2017). In the wake of Hurricane Sandy, 352,000 people was allocated  $403 million in FEMA assistance (CNN, 2017).  Five years later, many families living on the east coast still cannot fix all of the damage done, in terms of of the thousands of homes completely destroyed, and 90 lives lost (Schlossberg, 2015, para. 3). While we can continually rebuild and replace buildings and homes, we cannot bring back the lives taken in these increasingly worse coastal storms. In the past 30 years, floods have killed more than 500,000 people globally, and displaced about 650 million (Michaels, 2016, para. 1). Hurricane Harvey’s damage is estimated to be about $190 billion in damages, while the costs of Irma are projected to reach $100 billion. These costs burden taxpayers as they entail disruption to business, transportation and infrastructure damages, unemployment periods for many lasting up to months, loss of goods and crop (including 25 percent of orange crop), increased fuel prices, and property damages (Wile, 2017).  The United States government cannot afford the associated costs of building and rebuilding in these increasingly flood prone regions, nor can taxpayers. Because of society’s communal connections to land and region, it is understandable as to why people have chosen to settle their homes and communities on the coast. We have always been infatuated with living close to the beauty of nature, and water systems in close proximity have helped to support communities for centuries (Wilson et. al, 2010).

Instead of trying to dictate over nature or institutions that are intended for communities to seek assistance in order to rebuild and replace, perhaps we should shift our efforts that keep us safe financially and through damages that effect loss of lives and livelihood (Revkin, 2017, Sec. 2). It is the consensus of the scientific community that we are seeing increasingly intense hurricanes due to our warming climate (GFDL, 2017). Coastal communities have reflected devastating costs and damages more than any other community. If we can understand this relationship of increasing hurricanes due to the state of our changing climate, we can be more proactive in our future actions surrounding coastal development. Given that climate change is intensifying hurricanes, we must change the National Flood Insurance program to discourage future building in areas that will be prone to more frequent floods.

In 1968 Congress created the National Flood Insurance program (NFIP) after a series of hurricane-induced disasters.  The federal government got involved in existing disaster assistance programs by providing financial support only if a flood was officially declared to be a major disaster for communities that could not afford to continually support themselves (Lee & Wessel, 2017, para. 3). The NFIP is a federally subsidized program administered by the Federal Emergency Management Agency (FEMA), that enables homeowners, businesses, and renters in participating communities to insure their property if it is at risk of flood damage (Lee & Wessel 2017, para. 2). It was originally planned also that the federal government would make insurance available only within communities that adopted and enforced orders to manage development in floodplains (Lee & Wessels, 2017, para. 4). It has three components: Hazard identification and mapping, Floodplain management criteria and mitigation, and flood insurance (Lee & Wessel, 2017, para. 3).  

Roughly 28.2% of the United States population lives in a coastal hurricane-prone regions according to American Society of Civil Engineers (ASCE) criterion (Crowell, et al., 2010) and half are adopting insurance policies.  The ASCE definition of hurricane-prone regions as areas in the US Atlantic Ocean and and Gulf of Mexico where the wind is more than 90 miles per hour as well as islands off our coasts including but not limited to Hawaii, Puerto Rico, and Guam (ASCE, 2006). While the rates of adopting flood insurance policies among coastal communities is high, it is much lower inland.

When considering how people are able to live in these flood prone coastal zones, origins dates back to development and settlement in the coastal regions of the United States. Floodplain areas, or low-lying areas subject to flooding from a nearby waterbody, were advantageous to inland agricultural communities as a means of irrigation. For economic benefit, large cities were built near rivers and coastlines. This is because residents benefited from lower transport costs since they were close to ports and any trade that occurred there. In modern times we have improved transportation methods which makes this advantage obsolete (Michaels, 2016). Taking this into consideration, many people have lived in these areas for a long time, making it difficult to stop development in these areas where people live (Wile, 2017)

Additionally, the NFIP has incentivized living in these areas, making it not only possible to live here, but an attractive option. When people’s homes get destroyed they are simply able to rely on their flood insurance to rebuild their properties every time they there is damage (Lee & Wessel, 2017, para. 14).  The NFIP incentivizes this by offering low premium rates to those who need to insure their homes against flood damage. Federal funding easily repairs damages, the communities there are very resilient, and are able to keep rebuilding themselves to stay there.

The original objectives of the NFIP were to prevent unwise floodplain development through zonal mapping  ensure that property owners could receive coverage at a reasonable cost, get a large number of communities and property owners to buy insurance, and finally to base premiums on federal assessments of flooding risk so people would be aware of and bear the cost of choices they make (Lee & Wessel, 2017).

Most NFIP insurance policies are sold and run by private insurers under FEMA’s Write Your Own (WYO) program. The WYO is a program designed for FEMA and private insurers to collaborate, under FEMA’s rules and regulations. WYO allows the involved insurers to write and service the Standard Flood Insurance Policy (SFIP) in their own names. As agents of the federal government, the insurers receive an expense allowance for policies and claims processed while the federal government is responsible for underwriting losses (FEMA, 2017 & Marker, 2012). It is important to note that these insurers primarily serve an administrative function. This is a potential flaw with the NFIP because it means they do not bear the burden and associated risks with actually paying insurance claims (Lee & Wessel, 2017). This is problematic because they might be less cautious about building in flood-prone regions.

One issue making it difficult to disinvolve the NFIP from coastal development is the NFIP’s grandfathering rules. Grandfathering ensures that properties re-categorized as being at a higher risk of flooding under revised flood insurance maps will not be subject to large increases (Insurance Information Institute, 2017). Redrawing the flood-risk lines on insurance maps did not affect the low rates of insurance regardless of higher risk zone assessment (III, 2017).

While the NFIP has provided some coastal protection by providing incentives for new homes to be elevated above surge levels as well as strengthening buildings against windstorm damage, there still has been no solution to adapt to issues of increasing of sea level rise and increase of more intense hurricanes (Leathermann, 2017). It is due to lack of strict regulation by the NFIP, that there has been uneven enforcement of building restrictions on the floodplain (Revkin, 2017).

By making insurance for property in coastal regions readily accessible and appealing, the NFIP has led to a large amount of coastal development. The NFIP provides insurance at sizeable discounts for homes and other buildings constructed in flood-prone areas (Kristian, 2017, para. 4). This flood insurance is a federal mandate to have a mortgage in these zones (FEMA, 2017). One proposed idea is an increased premium price to cover and reflect the high risk of floodplain construction (Kristian, 2017, para. 6). This would then discourage vulnerable building plans among those who cannot afford to cover the cost of storm damage. As a result of more people being able to afford insurance in these areas, we have seen more properties being damaged by repeated flooding by increasingly intense hurricanes (Michaels, 2016, para. 3).

Hurricane intensity or severity are defined in a couple of ways. Firstly, we use the category or Saffir-Simpson scale of the hurricane, which is measured by the intensity of winds at the event on a scale of 1 to 5. Storm surge can be used to measure intensity as it examines an abnormal rise in water level on a coast. It is the water from the ocean that is pushed toward the shore by the force of the winds swirling around the hurricane. This advancing surge combines with the normal tides and can increase the water level by 30 feet or more. Storm surge combined with waves can cause extensive damage(US Department of Commerce, National Oceanic and Atmospheric Administration, 2011). Meanwhile, having a landfall hurricane means the eye of the storm reached land (Nosowit, 2012). When examining Sea surface temperature (SST) we found that it is a measurement of energy levels on the top layer of the ocean due to the movement of molecules. Spaceborne measurements give us a global measurement of sea surface temperatures (US Department of Commerce NOAA, 2011). Sea level rise (SLR) is the rise in global sea levels due to increase in temperature caused by release of greenhouse gasses as a result of fossil fuel combustion. The warming atmosphere transfers heat to the ocean’s surface waters and expands its volume (Ocean Health Index, 2017).With a better understanding of the connection between climate change and hurricane intensity, we will be able to implement the steps needed to prevent the associated economic, social, and environmental damages. In order to gain this deeper understanding, the scientific community considered various measures such as increasing SSTs, sea level rises, and landfall hurricanes.

Linear correlation showed there was a significantly high chance (82%) that global temperature  (GT) was causing an increase in SST. When it was tested inversely, for increased SST causing change in GT, it had an insignificant 31% of causality, much lower compared to the other way around. This statistic shows that there is a very high chance warmer global temperatures cause increased Atlantic SST (Elsner, J., 2006). Elsner (2006) explains that as climate change heats the Earth, the seas warm up and store significant amount of energy, which is converted to hurricane wind. This means that with climate change warming global surface temperatures, SSTs are then raised as a result. This increase is SST also has a significant effect on hurricanes. The rise in SST is causing more intense hurricanes. Major hurricanes, which are a Category 3 or higher on the Saffir-Simpson scale-which measures wind speeds to measure potential property damage (NOAA) , may intensify in response to the warming SST associated with global warming (Mousavi et al, 2011). They state that there is an average 8% increase in hurricane intensity for every 1 degree celsius of SST rise (Mousavi et al., 2011, p. 577). These results also indicate that local sea surface warming was responsible for 40% of the increase in hurricane activity relative to the 1950–2000 average between 1996 and 2005, which proved this to be a notably big increase (Saunders and Lea, 2008). This means that tropical hurricanes on Atlantic are extremely susceptible to intensity increase and frequency, with an increase in SST. This leads us to believe an increase in Climate change and GT, is causing more intense hurricanes overall.

Sea Level Rise (SLR) plays a huge role in hurricane intensity. SLR projections show that catastrophic ice-sheet melting, as a result of climate change, estimate SLR increases of 1 m or more over the next century (Mousavi et al. 2011).  This increase in SLR can mean one thing, more fuel for hurricanes and more water for the hurricanes to help the formation of floods. The storm surge is difference in water from normal to flood height (NOAA, 2017). Landfall hurricanes become increasingly dangerous as water is added to create flooding. An increase in SLR will give them the storm surge they need to cause more deadly floods. Balaguru. Et al. (2015) shows there is a 90% increase in storm surge due to SLR when looking at the projection from the Sea, Lake and Overland Surges from Hurricanes(SLOSH) projection. This means the intensity of storm surge in mainly dependent on, and worsened by increasing sea level.  This increase in SLR leads to more storm surge, which in turn causes more floods. A study shows between 1970 and 1999 the highest amount of fatalities during a hurricane was from floods. It also showed floods contributed in approximately 59% of the fatalities during hurricanes (Kaye, 2008).

With climate change leading to both more intense hurricanes and more SLR, we can only expect the number of fatalities and damages to go up from here. If the predictions and the projections are true, the more intense storms with higher SSR will keep doing more damage if we keep on building these coastal communities. As it currently stand there is an average of 28 Billion dollars against an 18 Billion dollar budget (CBO, 2017, slide 4). The projections show this number is going to increase and is going to be a 39 Billion dollars worth of damage versus a 24 Billion dollars budget (CBO, 2017, slide 4). That is why it is crucial to move people away from coastal areas to more inland.

One of the first actions to take is to improve floodplain maps to more accurately describe the flood risk and extent of the floodplain. Floodplain mapping is defined as a system in which the height of the 100-yr flood is estimated with at least a confidence interval of 50%, but the higher the confidence interval level goes the more accurate, more reliable and overall better the map would be (Burby, 2001). Floodplain mapping can help identify the safe locations. This will reduce and discourage development in the remainder of floodplain. One issue is that currently FEMA does not incorporate climate change projections or sea-level rise in their flood insurance maps. As it stands, they state their policy does not map flood hazards “based on anticipated future sea levels or climate change” and that “over the lifespan of a study, changes in flood hazards from sea level rise and climate change are typically not large enough to affect the validity of the study results” (FEMA 2017).  If Federal Emergency Management Agency flood maps incorporated future climate conditions, it would send a ripple effect into real estate and insurance markets. This would be something the public would have to acknowledge. If the federal government made it a legal requirement to have projected climate conditions to be considered in the flood insurance risk maps, construction practices would change to be more precautious (Revkin, 2017). Of course mapping these floodplain areas can also spread awareness. By mapping these and showing them to the community, they can be aware of the dangers, risks and consequences of building in these areas. So instead of doing the cheaper option, they can go the safer way.

People in hurricane zones are able to pay the cheap insurance premium and get subsidized in return after the hurricane damage. These cheaper insurances discourage people to build in other safer area but it prompts them to rebuild in the same area. Enforcing higher flood insurance premiums makes it more difficult to get federal disaster assistance, while reflecting the actual damages (Flavelle, 2017). There is evidence of insurance policies going more towards this direction. In 2012 congress passed the Biggert-Waters Insurance Reform Act, which aimed to extend the National Flood Insurance Program (NFIP) for five years (Kunreuther & Michel-Kerjan, 2017). The main focus of this extension was placing more of the insurance risks onto coastal property owners. When it gets more difficult and more expensive to get federal insurance, the more individuals and local officials would care about where to build, therefore building less in flood risk areas. As it is, when insurance premiums are too low and do not reflect the actual risk of loss, a resulting subsidy on the coastal development encourages people to support sprawling floodplain building (Burby, 2001). This is what we are currently witnessing in coastal communities, and we see it reflected in the sizable 28.2% of the United States population currently living in these coastal regions (Crowell et al. 2010). If they were able to raise the cost, that incentive would be removed. The NFIP cannot accommodate the future scale of  flood damages that are rapidly increasing under a changing climate; a study commissioned by FEMA to help it gain better understanding of this (AECOM 2013) has shown that existing 1% flood hazard zones are fundamentally underestimated given ongoing climatic change (Shively, 2017). Making the insurances more inaccessible, more difficult to get and more expensive would eventually help the community. With more difficult to attain insurance, people will be urged to build in safe floodplain areas, discouraging further development in flood zones. (Flavelle, 2017; Burby 2001). If it becomes unattainable, development will be forced more inland.

There is no doubt that raising premiums and making insurance less accessible will be difficult to pass initially. This is because homeowners will not want their insurance costs raised, and homebuilders will not want to be out of business if coastal development is discouraged. For homeowners, if the premium is raised they might benefit from moving to a safer region inland. In doing this, we believe that the burden of losing their belongings and endangering their families will be eased. While many items can arguable be replaced by insurance, there are a fair amount of things that are irreplaceable. They also will not suffer from the economic loss of unemployment periods, associated with the damage from hurricanes in these flood regions (Wiles, 2017). As for homebuilders, if the rates increase they might lose money at first. Everyone moving away from the coastal communities and less people building near the coast will have an impact on them in the beginning, but over time they would have more chances to build bigger and better complexes away from the flood risk without their building and houses being destroyed. It can also provide the homebuilders with a safe community they can live in themselves with their families (Friedman & Scism, 2017).

We propose that the package of bills proposed by the House Financial Services Committee, pushed by Chairman Jen Hansarling (R-TX) be passed into law. The bill package would renew the NFIP program for five years. It would also enact the raise of insurance premiums, which we advocated for. In doing so it would make coverage more expensive for policyholders, and make it easier for private companies to sell their own flood insurance policies (Lee & Wessel, 2017). We also propose the passage into law of the House and Senate backed bill called; Sustainable, Affordable, Fair and Efficient (SAFE) NFIP Reauthorization Act. This bill supports what we suggested as it calls for greater investments in flood risk mapping and risk mitigation (Lee & Wessel, 2017).

AUTHORS

Amir Entekhabi – Environmental Science

Rachel Finn – Natural Resource Conservation

Keren Radbil – Agricultural and Environmental education


REFERENCES

Burby, R. J. (2001). Flood insurance and floodplain management: the US experience. Global Environmental Change Part B: Environmental Hazards, 3(3), 111-122. DOI 10.1016/S1464-2867(02)00003-7.

Congressional Budget Office. (2017). Effects of Climate Change and Coastal. Retrieved from: https://www.cbo.gov/publication/53244

Development on U.S. Hurricane Damage: Implications for the Federal Budget. Retrieved from: https://www.cbo.gov/system/files/115th-congress-2017-2018/presentation/53244-presentation.pdf.

Crowell, M., Coulton, K., Johnson, C., Westcott, J., Bellomo, D., Edelman, S., & Hirsch, E. (2010). An estimate of the US population living in 100-year coastal flood hazard areas. Journal of Coastal Research, 201-211. DOI 10.2112/JCOASTRES-D-09-00076.1

Effects of Climate Change and Coastal Development on U.S. Hurricane Damage: Implications for the Federal Budget. (2017, November 02). Retrieved December 04, 2017, from https://www.cbo.gov/publication/53244

GFDL. (2017). Global Warming and Hurricanes. Retrieved from: https://www.gfdl.noaa.gov/global-warming-and-hurricanes/.

Friedman, N., & Scism, L. (2017, October 23). What Could Raise Hurricane Irma’s Costs? Letting Contractors Handle Claims. Retrieved November 29, 2017, from https://www.wsj.com/articles/what-could-raise-hurricane-irmas-costs-letting-contractors-handle-claims-1508756401

Flavelle, C. (2017). Hurricanes Highlight Failure to Enforce Flood Insurance Rules. Bloomberg Businessweek. Retrieved from: https://www.bloomberg.com/news/articles/2017-09-13/hurricanes-highlight-failure-to-enforce-flood-insurance-rules.

Fessler, P. (2017, September 01). At Least 100,000 Homes Were Affected By Harvey. Moving Back In Won’t Be Easy. Retrieved December 04, 2017, from https://www.npr.org/2017/09/01/547598676/at-least-100-000-homes-were-affected-by-harvey-moving-back-in-wont-be-easy

Holter, L. (2017, August 31). I Lost My Home In Hurricane Harvey. Retrieved December 04, 2017, from http://www.refinery29.com/2017/08/170287/lost-my-home-hurricane-harvey-flood

Hurricane Sandy Fast Facts. (2017, October 19). Retrieved December 04, 2017, from http://www.cnn.com/2013/07/13/world/americas/hurricane-sandy-fast-facts/index.html

Insurance Information Institute. (2017). Retrieved from: https://www.iii.org/publications/insurance-handbook/insurance-and-disasters/background-on-flood-insurance

Kristian, B. (2017). The Week. Retrieved from: http://theweek.com/articles/721185/perverse-incentives-national-flood-insurance-program

Kaye, K. (2008, July 12). Inland flooding causes most hurricane deaths. Chicago Tribune. Retrieved from: http://www.chicagotribune.com/sns-cane-inlandfloods-story.html

Leatherman, S. P. (2017). Coastal Erosion and the United States National Flood Insurance Program. Ocean & Coastal Management. Chicago. DOI 10.1016/j.ocecoaman.2017.04.004.

Lee, V., & Wessel D. (2017). “The Hutchins Center Explains: National Flood Insurance Program.” The Brookings Institution. Retrieved from: https://www.brookings.edu/blog/up-front/2017/10/10/the-hutchins-center-explains-national-flood-insurance-program/.

Michaels, G. (2016). The Conversation. Retrieved from: http://theconversation.com/why-are-so-many-people-still-living-in-flood-prone-cities-55281

Marker, S. (2012). What Is The Write-Your-Own Insurance Policy Program? Merlin Law Group. Retrieved from: https://www.propertyinsurancecoveragelaw.com/2012/07/articles/insurance/what-is-the-writeyourown-insurance-policy-program/

Nosowitz, D. (2012, October 29). The Dictionary Of Hurricane Sandy: Landfall. Retrieved October 20, 2017, from https://www.popsci.com/science/article/2012-10/dictionary-hurricane-sandy-landfall

Revkin, A. (2017). Rethinking the ‘Infrastructure’ Discussion Amid a Blitz of Hurricanes. ProPublica. Retrieved from https://www.propublica.org/article/rethinking-the-infrastructure-discussion-amid-a-blitz-of-hurricanes.

“Saffir-Simpson Hurricane Wind Scale.” National Hurricane Center, NOAA, www.nhc.noaa.gov/aboutsshws.php.

Schlossberg, T. (2015). New York Today: In Hurricane Sandy’s Wake. Retrieved from https://www.nytimes.com/2015/10/29/nyregion/new-york-today-in-hurricane-sandys-wake.html.

Shively, D. “Flood risk management in the USA: implications of National Flood Insurance Program changes for social justice.” Regional Environmental Change 17.6 (2017): 1663-1672. DOI 10.1007/s10113-017-1127-3.

US Department of Commerce, National Oceanic and Atmospheric Administration. (2016, September 04). What is storm surge? Retrieved November 29, 2017, from https://oceanservice.noaa.gov/facts/stormsurge-stormtide.html

Wile, R. (2017). http://time.com/money/4935684/hurricane-irma-harvey-economic-cost/

Kunreuther, H., & Michel-Kerjan, E. (2017, November). Implementing the National Flood Insurance Reform Act in a New Era of Catastrophes. Retrieved November 15, 2017, from https://publicpolicy.wharton.upenn.edu/issue-brief/v1n9.php