Tag Archives: crowdsourcing

Smarter scheduling in SurveyMan

Conventional wisdom (and testimonials from researchers who have been burned) says that time of day can introduce bias into crowdsourced data collection. Right now, SurveyMan posts a single HIT per survey, requesting $$n$$ assignments. If we collect $$n$$ assignments and find that they are low quality, we ask for more by extending the HIT.

What happens if we get $$n$$ valid responses in the first hour of posting? Is the distribution of responses going to be the same as if we had posted $$n$$ hits, distributed throughout the day? If I am posting surveys about American politics, I will want have them available when the largest number of American Turkers are active. However, if I am asking for annotations, do I need to be conscious of potential differences? The question of bias is insidious because we don’t know precisely when it applies. Andrew Mao has written about scheduling tasks during peak AMT worker hours. However, there’s still a lot domain knowledge and planning involved. Planning properly requires constant vigilance, since it’s not even clear that peak worker hours will remain the same over time: a recent paper found that the alleged biases in the mechanical turk population had either sorted themselves out or had been overstated. Conversely, Ipierotis et al. established an AMT demographic tracker, which can help identify subtle population biases.

Regardless of whether or not biases exist, most machine learning models that use AMT data account for this in some way. There is typically some unknown bias term drawn from a reasonably well-behaved distribution that can then be marginalized. When demographers and pollsters tackle this issue, they typically know something about the underlying population and account for uneven sampling with this prior information. However, when we don’t know anything about what the underlying population is supposed to look like, or if we have little prior information for our variables of interest, we may be in a bit of a bind.

Toward automatic detection of population differences

As an alternative to these approaches, I am implementing a prototype scheduler in SurveyMan that dynamically tests for biases. Let’s start with the basic assumption that there are no biases in data collection and that people answer our HITs within an hour of our posting. Since we cannot be sure of our assumption, we post a HIT with $$n/2$$ assignments at $$t_0$$ and $$n/2$$ assignments at $$t_{12}$$, where the subscripts indicate hours from the start of data collection. We schedule these two batches 12 hours apart in an attempt to get a kind of maximum difference in populations: as the researcher, if I am kicking off a survey at this time, chances are people who share demographic features to me will also be awake and working when I am working. However, 12 hours from now, I expect to be asleep and it might happen that the people who are taking my survey are quite different.

First challenge: how do we even tell if there are differences in the survey responses?

Approach 1: Check for differences in the distributions observed for each question.

We look at the responses generated for a set of questions at two different times and calculate whether the distributions are significantly different. Since we will probably end up with a bunch of low-powered comparisons, we are likely to detect a difference. However, since we know the number of questions we’ll ask (and therefore the number of comparisons we’ll make) a priori, we should be able to model our false positive rate.

How many questions must be different for us to consider the populations fundamentally different? What happens if we find a significant difference between the responses for a particular question, but this question doesn’t have an impact on the analyses we might do? For example, suppose that we find different responses for a control question, but no difference in the questions of interest. Should we run the survey again?

Maybe one way of thinking about this approach is that it’s like an AutoMan approach, but in batch mode. I like to tell people that the way we came up with the idea for SurveyMan started out as a way to deal with batches of AutoMan tasks that converged to a distribution, rather than a point. Looking for individual differences in questions is a related problem, but it doesn’t really leverage running things in batch.

Approach 2: Look for differences in correlations.

For small numbers of questions, differences in distributions may suffice, but for a more complex survey, a more informative measure might be to look for differences in correlations between questions. This may do a better job of highlighting “important” differences in populations. Since it is very unlikely that we would find correlation coefficients that are exactly the same, we would need to be careful about how we might compare discovered correlations. How much variation should we expect? What’s our baseline? Zero correlation seems silly; is there a more meaningful baseline? Surely the baseline would depend on the survey itself.

If we expect there to be fluctuations in the demographics of AMT workers, why don’t we just post our surveys in slow progression — maybe one per hour? In addition to the troubles caused by the underlying AMT system (we get a boost when we first post; after a certain amount of time, engagement tapers off), we waste time doing this. It also isn’t clear what the scale of variation is — should we post over the course of a day, a week, a month, or a year? Some AMT demographic surveys run for at least one year. Clearly this is infeasible for many other types of research (e.g., the work we’d been doing with the linguists).
How to interpret entropy

Note: This is a post that I started some time ago and have had in my todo list to finish for…maybe a year now? Apologies for the delay!

We’ve argued that more entropy in a survey is better for detecting bad actors. The argument goes like this: A survey of 5 yes/no questions has (ignoring breakoff) 32 possible unique answers. The maximum entropy of this survey is

$$-5\bigl(\frac{1}{2} \log_2(\frac{1}{2}) + \frac{1}{2} \log_2(\frac{1}{2}) \bigr) = -5\bigl(-\frac{1}{2} – \frac{1}{2}) = 5$$.

This seems rather low. Clearly if we were to ask our usual 150 respondents to answer this survey, we could easily run into problems being able to tell the difference between good and bad actors. We’ve argued that as the length of the survey and the “width” (i.e., number of options a question has) increase, it’s easier to catch random actors. However, we also know that especially long surveys can cause fatigue, making good respondents behave badly.

How much entropy is enough?

We ran a couple of simulations to find out what the relationship was between entropy and accuracy. Cibele and I ran a bunch of baseline analyses under idealized circumstances for our machine learning final project. In the project, we used our strongest adversary (the lexicographic respondent, mentioned in a previous post) as our model for honest respondents. We did this because we could then use an already-written module for a population of respondents who always gave fixed response set. Most of the analyses did well.

However, if we really want to know whether we can debug real surveys, we have to consider doing so under non-ideal circumstances. We consider a situation like the non-random respondent described in our simulator, where these responses are mixed in with some random respondents. Extracting the non-random respondents from the random respondents is our goal, which is significantly easier when we use something like the lexicographic respondent, rather than the simulator’s respondent. The goal of the machine learning project was in part to investigate the different approaches’ robustness to bad actors. This post is about what actions a user might take in response to a survey that does not lend itself to detection of bad actors.

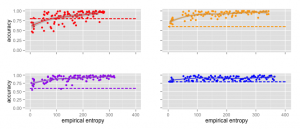
When we’ve asserted that more entropy is better, we weren’t actually saying what we mean — what we mean is that the potential for more entropy is better. That is, a larger space of possible options is better. Let’s take a look at the empirical entropy of the survey plotted against the accuracy for surveys having 20%(red), 40%(purple), 60%(orange), and 80%(blue) bad actors. Each graph has 100 points, corresponding to 100 different surveys. The surveys were generated programatically, starting with 5 questions, each having 4 answer options, and increasing the number of questions and answer options incrementally. The dotted line is a baseline guess and corresponds to the dominant class.

accuracy_entropy

Over all, we see the loess regression line correlate higher empirical entropy due to to survey structure (rather than the increase in the percentage of bots, which is not informative) with higher accuracy. However, this trend isn’t as informative as it might appear: the upper bound of 100% and the lower bound of a naive classifier make the apparent trend less compelling. Note that when we have 20% bad actors, we observe much higher variance. Let’s take a closer look at the data to see if there isn’t something else going with this data.

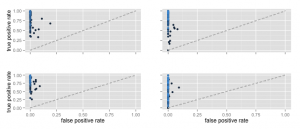
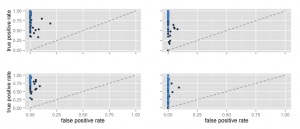
roc

The graphs flow down and to the right. The colors of the dots correspond to the empirical entropy; lighter is higher. All graphs use a scale from 0 to 400 bits.

The first thing that jumps out with these graphs is that the false positive rate is very low. The classifiers are very conservative — they rarely classify a bad actor as an honest respondent. However, there doesn’t appear to be a clear trend between total entropy and either the false positive rate or the true positive rate.

Since our main argument is about the utilization of the search space, let’s take a look at the relationship between the maximum possible entropy and the empirical entropy. Maximum possible entropy is a kind of resource we want to conserve. We prefer to have a large reservoir of it, but only use a small amount. Let’s plot the ROC “curve” as before, but this time use the ratio of empirical entropy to the maximum possible entropy to color the points we observe:

roc2

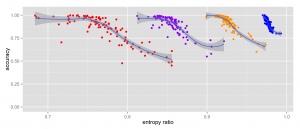
This looks a little better, but is hard to read and/or reason about. Dan suggested plotting the entropy ratio against the accuracy, much as we plotted the entropy against the accuracy:

accuracy-entropy-ratio

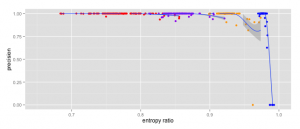
At the same entropy level (e.g., 0.85), our accuracy is lower for the scenario with 20% bots than for the scenario with 40% bots. Since the false positive rate is very low, this boost isn’t coming from from a better classifier, since our greater number of bad actors is increasing the accuracy. Let’s now take a look at just the entropy ratios plotted against precision:

entropy_ratio_precision

Debugging

So what does this all mean? The end user should try to minimize the ratio of empirical entropy to maximum possible entropy. This can be done by adding more control questions, or padding existing questions with more options. Since we know most of the quality control techniques we use are robust to false positives, we focus on trying to detect true positives.

Alternate Backends for PLASMA Crowdsourcing Tools

Although in practice AutoMan and SurveyMan were both designed to make their backends pluggable, we have yet to implement an alternate backend for either because there simply aren’t any AMT competitors out there. There are plenty of crowdsourcing websites, but none are as programmable as AMT and few are as general. That is to say, all competitors appear to offer specialized labor markets and/or be designed for specialized work.

A known problem with the labor market on Amazon is that, even if you pay your workers minimum wage based on time actually spent on a task, they spend a significant amount of time searching for tasks. There are websites set up to facilitate this process, but it’s still time spent searching for work, instead of actually working. A major subfield of alternate approaches involves extracting work either voluntarily, or in contexts where non-monetary compensations make sense. Quizz uses Google’s advertising system to embed knowledge-mining quizzes in with its usual ads. Other approaches substitute consumer marketing tasks or questions for paywalls. In both cases, users are motivated by something other than payment.

I’ve been wondering for a while whether thefacebook would be a good platform for our software. Although the general understanding is that respondents are anonymized, but we know this is not true. Researchers have assumed that workers are independent. Recent work out of MSR has found that some Indian workers actually collaborate on tasks. For these reasons, I think Facebook would be a perfectly reasonable alternate platform for crowd sourcing. In fact, I believe that Facebook is a better platform for crowdsourcing, since it overcomes ones of the major shortcomings of AMT — people are already hanging out there*. Rather than appeal to a populace that is explicitly looking for work, sometimes as a primary source of income, we would like to instead use a Facebook to tap into people’s excess capacity**.

Since Facebook doesn’t currently have a crowdsourcing interface, could we mock up a substitute using what’s already available? Amazon currently handles listing, pool management, payment, presentation, and offers a sandboxed version of AMT for testing. A minimal implementation would involve hosting our own *Man servers and just using Facebook advertising to recruit workers. However, this diverts the user away from the Facebook ecosystem, which defeats the purpose of using Facebook in the first place (for example, we could just as easily use Google AdWords instead).

To keep users in the ecosystem, we could write a SurveyMan app***. I looked into this briefly, and while it isn’t as integrated into the main Facebook experience as I’d want, it’s closer than routing users to an outside website. We could use Facebook advertising to do the initial recruitment and then use wall updates to bootstrap that process. If Facebook advertising provided a way to target ads to particular demographics, we would have a better time with bias in our sample.


* Admittedly, I am not a regular user of thefacebook. I've heard the "so and so spends their whole day on facebook" complaint, but I really don't know how common this is. Consequently, this post is predicated on the idea that thefacebook is a place where people spend a lot of time, not doing work. I have heard that this is less the case since mobile became ubiquitous.

** TBH, I think the cult of excess capacity is unethical, but for the sake of capitalism and this blog post, let's assume it isn't. I will save a discuss of ethics and excess capacity later.

** Word on the street is that no one actually uses these things anyway...