The End of the Pandemic: A Case for Optimism

As we reach the end of a year in which the world has suffered through the worst respiratory-disease pandemic in a century, it is natural that we look ahead and wonder what we should expect for the coming year.  Speculation about the timeline for a “return to normal” began as early as April, when the pandemic had just begun to unfold in Europe and North America.  Nine months later, it is increasingly a topic of discussion both in the public sphere and in casual conversations amongst friends and neighbors.  One of the more striking aspects of this discourse is how persistently gloomy it remains in many corners, despite the mounting evidence that augurs a relatively quick return to the vibrant, healthy society that existed before the pandemic.  Much of this pessimism can be attributed to the ever-present reminders of the most frightening aspects of the pandemic – the COVID dashboards and graphics, the steady drumbeat of reporting of death milestones, the comparisons of the death toll to that of terrorist attacks – and the sensationalist reporting of outcomes that are exceedingly rare and, often, only very tenuously attributable to COVID (Kawasaki-like disease in children[1], teeth falling out[2], erectile disfunction[3], psychoses[4]).  All the while, positive signs are typically shrouded in a cloud of caveats and qualifying statements that cast doubt on the reliability of the information.  Over time, this has solidified into a standard narrative that has proved remarkably difficult to counter.  The end result is a populace increasingly pushed to the limits of COVID fatigue, left wondering if society will ever regain its footing.

Early in 2020, experts spoke of an effective end of the pandemic and return to a “new normal” in late 2021, at the earliest, with the arrival of an effective vaccine coming too late to make a significant difference in the overall timeline.

“we must be prepared for at least another 18 to 24 months of significant Covid-19 activity, with hot spots popping up periodically in diverse geographic areas…So, lacking a vaccine, our pandemic state of mind may persist well into 2021 or 2022…”

https://www.nytimes.com/2020/05/08/health/coronavirus-pandemic-curve-scenarios.html (“This Is the Future of the Pandemic,” Siohban Roberts, 8 May, 2020)

This set the baseline for expectations:  a pandemic, with its concomitant non-pharmaceutical interventions (NPI), consisting of lockdowns, social distancing and other suppression efforts, that will span a miserably long period of 18 to 24 months.

As we entered the Fall, however, the first glimmers of hope for a more rapid escape from the nightmare were emerging:  early results from several vaccine trials were promising, and timelines indicated that millions of doses could be ready for distribution to the population as early as the end of the year.  Not to be deterred, the reflexive posture of the media was to temper expectations and frustrate any nascent effort to begin seeing the light at the end of the tunnel!

“Americans are also overestimating what a vaccine might do. Many are focusing on whether approval is being rushed as a campaign ploy, but that’s almost beside the point. It seems likely that a vaccine will be approved this fall and that it will be ‘effective.’ But it’s very unlikely that this vaccine will be a game changerWe don’t know yet where a coronavirus vaccine will fall, although something along the lines of a flu shot seems more probable. We don’t know how long whatever immunity it provides will last. We don’t know whether there will be populations that derive more or less benefit…Even this assumes, of course, that we can distribute the vaccine widely and quickly (which is doubtful), that most people will get it (many won’t) and that we will succeed in prioritizing distribution so that those most at risk will get it first (flying in the face of decades of disparities in the way health care is distributed).”

https://www.nytimes.com/2020/09/15/opinion/coronavirus-precautions.html (“Stop Expecting Life to Go Back to Normal Next Year,” Aaron Carroll, 15 Sep., 2020)

In November, many of these unknowns evaporated, when efficacy and safety results for the Pfizer and Moderna vaccines were finally released:  efficacies of around 95%, far surpassing expectations, and no reported serious adverse effects in the more than 20,000 individuals who participated in the vaccinated arm of each of the trials.

“’This is really a spectacular number,’ said Akiko Iwasaki, an immunologist at Yale University. ‘I wasn’t expecting it to be this high. I was preparing myself for something like 55 percent.’”

https://www.nytimes.com/2020/11/09/health/covid-vaccine-pfizer.html (“Pfizer’s Early Data Shows Its Vaccine is More Than 90% Effective,” Katie Thomas, David Gelles, Carl Zimmer, 9 Nov., 2020)

“The drug maker Pfizer said on Wednesday that its coronavirus vaccine was 95 percent effective and had no serious side effects…The data showed that the vaccine prevented mild and severe forms of COVID-19, the company said. And it was 94 percent effective in older adults, who are more vulnerable to developing severe Covid-19 and who do not respond strongly to some types of vaccines.”

https://www.nytimes.com/2020/11/18/health/pfizer-covid-vaccine.html (“New Pfizer Results:  Coronavirus Vaccine is Safe and 95% Effective,” Katie Thomas, 18 Nov., 2020)

Surely with a vaccine of spectacularly high efficacy presently in deployment, Americans could now begin to entertain some degree of hope that life would return to normal on an appreciably shorter timeline than previously imagined?  Not so fast, we are told.  While a “minority” of the experts believe this possible, the consensus is, strangely, as pessimistic as ever – no change in the baseline!

“A minority of the epidemiologists said that if highly effective vaccines were widely distributed, it would be safe for Americans to begin living more freely this summer: ‘I am optimistic that the encouraging vaccine results mean we’ll be back on track by or during summer 2021,’ said Kelly Strutz, an assistant professor at Michigan State University…But epidemiologists are a very cautious group. Most said that even with vaccines, it would probably take a year or more for many activities to safely restart, and that some parts of their lives may never return to the way they were.  Karin Michels, professor of epidemiology at U.C.L.A., said it would probably be many years until it was safe enough to ‘return to approximately the lifestyle we had.’ She said, ‘We have to settle to live with the virus.’”

https://www.nytimes.com/2020/12/04/upshot/epidemiologists-virus-survey-.html (“How 700 Epidemiologists are Living Now, and What They Think is Next,” 4 Dec., 2020)

This mostly-unidentified panel of 700 experts are indeed some of the most cautious members of the population. According to the article, 74% had yet to send their children on an outdoor playdate, 38% had not yet “hiked or gathered outdoors with friends,” 28% still were not “bringing in mail without precautions,” and 10% had not even “gone on errands, such as to the grocery store or the pharmacy.”  Little wonder, then, that they foresee such a long, possibly never-ending road to the pre-COVID life many of us are already forgetting had ever existed.

Even Dr. Anthony Fauci, America’s most respected expert in infectious diseases, is apt to keep us off balance – grateful for the unprecedented speed in which highly-effective vaccines have been developed and brought to market, while all the same quietly ‘moving the goal posts.’

“Recently, a figure to whom millions of Americans look for guidance — Dr. Anthony S. Fauci, an adviser to both the Trump administration and the incoming Biden administration — has begun incrementally raising his herd-immunity estimate…In a telephone interview the next day, Dr. Fauci acknowledged that he had slowly but deliberately been moving the goal posts. He is doing so, he said, partly based on new science, and partly on his gut feeling that the country is finally ready to hear what he really thinks…”

https://www.nytimes.com/2020/12/24/world/how-much-herd-immunity-is-enough.html (“How Much Herd Immunity is Enough?” Donald McNeil, 24 Dec., 2020)

Does any of this make sense?  The myriad deleterious effects from NPIs being just as serious as COVID itself, should we not strive to end them on as hasty a timeline as reasonably possible?

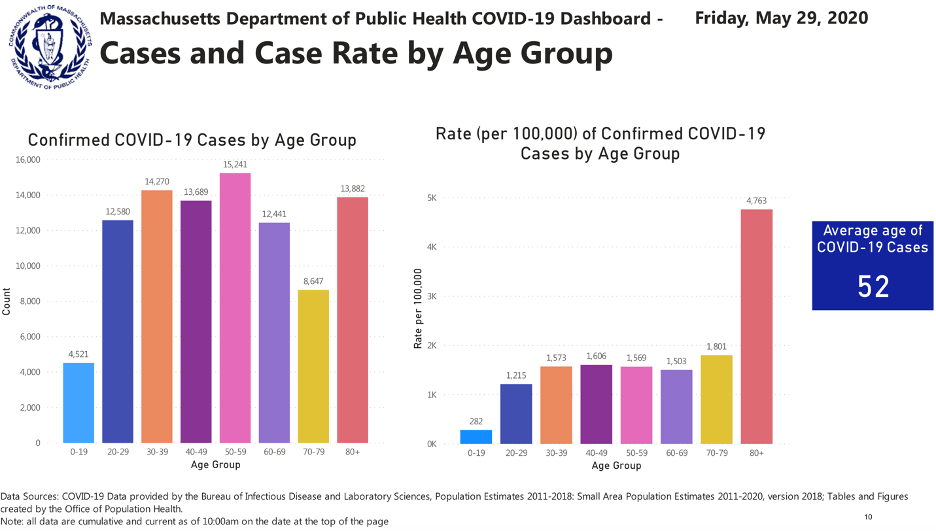
If we make a reasonable appraisal of the situation in the US, and put aside any biases we may have due to ‘gut feelings,’ the forecast for 2021 is decidedly more positive than most seem to realize.  The distinguishing feature of the pandemic is the relatively high rate of hospitalizations and deaths attributable to COVID in the elderly population, and it is in this population that a successful vaccination campaign will be paramount.  Nursing home residents make up a dramatically disproportionate share of COVID deaths.  They represent less than 1% of the US population (about 2.5 million, in all), but so far account for more than 38% of all COVID deaths (https://covidtracking.com/data/long-term-care) – and in some states, the figure is much higher (in Massachusetts, it stands at 60%).  More than one million Americans have already received the first dose of the vaccine, and by the middle or end of January we can expect that all residents and workers in nursing homes will have been vaccinated; in the Massachusetts schedule (https://www.mass.gov/info-details/when-can-i-get-the-covid-19-vaccine), this group is second highest in priority amongst the six groups covered by Phase 1 of the campaign, where the projected timeline is December 2020 – February 2021.  The next-most at-risk demographic is elderly Americans living in the community (outside of care homes):  persons over 70 years old, about 15% of the population, account for 80% of COVID deaths (https://www.cdc.gov/nchs/nvss/vsrr/covid_weekly/index.htm)  A credible estimate for when this group will have been fully vaccinated is the end of March or April (Phase 2 in the Massachusetts plan).  The Pfizer and Moderna vaccines have been shown to work nearly equally well in the elderly population as they do in in the younger population, and they reduce Sars-Cov-2 infections that present as mild to moderate symptoms by a factor of twenty.  There were zero cases of severe symptoms and zero deaths in the vaccinated groups, signifying protection against severe forms of COVID very close to 100%.  It follows that hospitalizations and deaths due to COVID will steadily fall through the Winter, as the most at-risk members of the population become inoculated.  As an example, the daily rate of COVID deaths in the population over 70 would be reduced, via vaccination, from its current value of about 1,800 (nearly its highest value since the pandemic began) to less than 90! 

But the fraction of the population that is vaccinated does not tell the whole story – there are also the tens of millions of Americans who have acquired durable immunity through infection by the virus itself.  Many seem to believe, having been influenced by early, misleading media reports regarding waning antibody levels, that immunity is either very fleeting or even on-existent.  The truth of the matter is that reports of reinfection remain vanishingly small and all evidence points to long-lasting immunity – likely a year or two, possibly even longer.

“Within the last couple of months, several scientific studies have come out — some peer-reviewedothers not — indicating that the antibody response of people infected with SARS-CoV-2 dropped significantly within two months. The news has sparked fears that the very immunity of patients with Covid-19 may be waning fast — dampening hopes for the development of an effective and durable vaccine.

But these concerns are confused and mistaken…”

(“Scared That COVID-19 Immunity Won’t Last?  Don’t Be,” Akiko Iwasaki and Rusian Medzhitov, 31 July, 2020)

“How long might immunity to the coronavirus last? Years, maybe even decades, according to a new study.”

https://www.nytimes.com/2020/11/17/health/coronavirus-immunity.html (“Immunity to the Coronavirus May Last Years, New Data Hint,” Apoorva Mandavilli, 17 Nov., 2020)

The CDC estimates that by the end of November 2020 about 91 million Americans had already been infected (https://www.cdc.gov/coronavirus/2019-ncov/cases-updates/burden.html, https://academic.oup.com/cid/advance-article/doi/10.1093/cid/ciaa1780/6000389).  Using the same model parameters, it is conceivable that around 120 million, more than a third of the US population, will have been infected by the end of December.  Unlike in the earliest phase of the epidemic, younger Americans (< 50 years of age) are now the majority of those being infected.  Combining this large population of younger Americans who have acquired immunity naturally with the vaccinated population, which will initially skew towards older Americans, the full population-wide, or herd, immunity will already be very substantial by mid-Spring 2021, when the vaccine becomes available to the general population (Phase 3 in the MA plan).  The growth of herd immunity through the Winter and Spring will drive hospitalizations and deaths in the under 70 segment of the population to progressively lower levels, even before accounting for the effects of vaccination in this same group.

A likely scenario is that by Summer 2021 COVID will have ceased to be a serious public health threat and Americans of all ages will be leading normal lives, unburdened by the demands of social distancing.  The restaurant, hospitality, tourism and cultural event sectors of the economy will finally emerge from the devastation wrought by the pandemic and we will be on the road to full economic recovery.  Such is the story of every pandemic of the last 100 years (Fig. 1), and there is absolutely no reason to believe that this one is any different.

“According to historians, pandemics typically have two types of endings: the medical, which occurs when the incidence and death rates plummet, and the social, when the epidemic of fear about the disease wanes.”

https://www.nytimes.com/2020/05/10/us/coronavirus-deaths-cases.html (“When Will the Pandemic End?  And How?” 10 May, 2020)

A picture containing graphical user interface

Description automatically generated

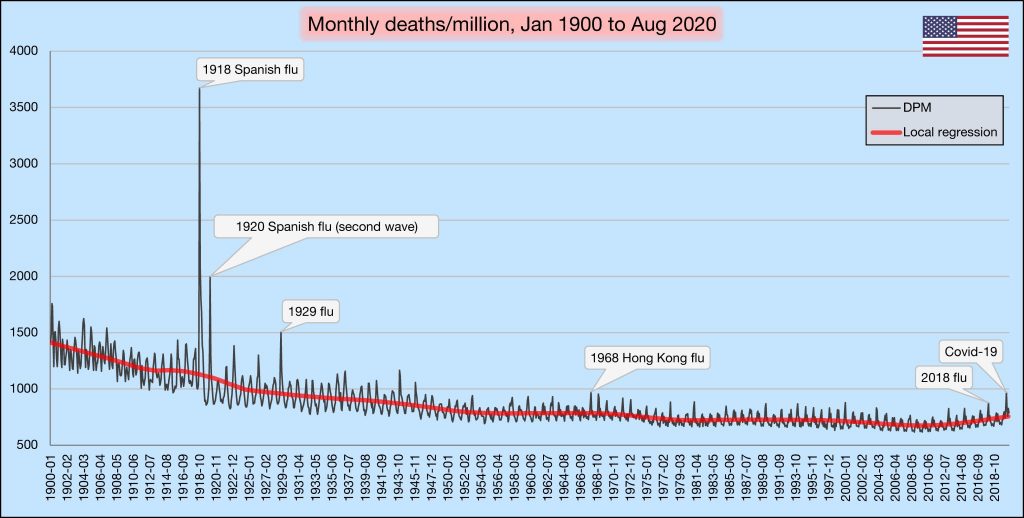
Figure 1: Number of deaths (all-cause) per month, per million inhabitants, Jan. 1900 – 1 Sep. 2020, as recorded by the US CDC.  Notable respiratory-disease pandemics are indicated (most other peaks are seasonal, non-pandemic influenza deaths).  N.B. The graph includes data through the end of Aug. 2020, when Covid-19 deaths tallied 188,000 – there is a second peak of an additional 140,000 total deaths in the final four months of the year (106 deaths per month, per million).  Credit: @VoidSurf1 (Twitter Handle), from public CDC data (https://www.cdc.gov/nchs/nvss/mortality/hist293.htm

Carlo Dallapiccola (carlo.dallapiccola@gmail.com)

Thanks to Rosie Cowell, Dave Huber and Adrian Staub for helpful discussion and comments.


[1] https://www.washingtonpost.com/health/2020/05/05/coronavirus-children-kawasaki-syndrome/ “15 children in New York City have developed a puzzling and serious inflammatory syndrome possibly linked to covid-19,” 5 May, 2020.

[2] https://www.nytimes.com/2020/11/26/health/covid-teeth-falling-out.html “Their Teeth Fell Out. Was It Another Covid-19 Consequence?” 28 Nov., 2020.

[3] https://www.nytimes.com/2020/06/04/smarter-living/the-pandemic-is-stressing-your-body-in-new-ways.html “The Pandemic Is Stressing Your Body In New Ways,” 4 June, 2020.

[4]https://www.nytimes.com/2020/12/28/health/covid-psychosis-mental.html “Small Number of Covid Patients Develop Severe Psychotic Symptoms,” 28 Dec., 2020.

Measuring the Toll of a Pandemic

Setting policy in a pandemic is about trading off between alternative bad outcomes: coronavirus deaths, chronic virus-related illness, postponed medical procedures, economic devastation, missed education, increased mental illness, and on and on. There is no way out of a pandemic without incurring costs on some, or all, of these dimensions. But to chart the best course, we need, at a minimum, a good way of counting the toll for each.

Locally, most public schools remain closed and two recent Gazette reports highlighted one way of measuring the impact of this. As feared, children from low-income and racial/ethnic minority demographics have experienced a disproportionate rise in absenteeism under remote education. Doubtless, this will widen the already unacceptable gap between the most and least fortunate children in our society. Other negative effects of non-pharmaceutical interventions (NPIs) have impacted millions of adults: devastating social isolation in people who live alone, economic ruin for small business owners, financial and mental health crises in the unemployed, increased domestic violence against women, and more. These negative impacts of pandemic-mitigation measures will take years to measure; counting their toll as the pandemic unfolds is almost impossible.

What is certain is that both the virus itself and the NPIs it has invited have caused public health crises of unprecedented magnitude; both COVID and the lockdowns will lead to significantly reduced life expectancy in the worst afflicted groups. In deciding how to balance them, it is critical that we have an accurate estimate of the current and likely future impact of this devastating viral disease. How many people is COVID killing, now, in Massachusetts, and how many more virus-caused deaths can we expect to see under different policies?

The most straightforward way to do this is to look at COVID-related deaths in the comprehensive daily data summaries provided by the Massachusetts DPH (published on Mass.gov, the New York Times, and Worldometers.info). These data show COVID-related deaths at a steady level of 12-15 per day during the summer, followed by an increase, albeit not yet an exponential one, since October.

COVID deaths in Massachusetts this Fall have therefore been lower than in many states, but certainly not at zero. In our attempts to minimize the harsh effects of lockdowns, how should we set a threshold for determining the virus to be sufficiently “under control” to allow businesses and, most importantly, schools to open? A related question: are we sure that our measures of COVID-caused deaths are accurate? Are they too conservative (missing many cases) or too lax (chalking up deaths to COVID inappropriately)?

A hint that the counting of deaths is a difficult business comes from large variability in Case Fatality Rates in different regions ? that is, the number of deaths divided by the number of detected infections. (This is always an over-estimate of the Infection Fatality Rate, the number of deaths per number of infections, because we will always miss a greater proportion of COVID infections than of COVID deaths). However, if we examine two regions in which the per capita testing rate is similar, and hospital care can be assumed similarly effective, we’d expect the CFR to be about the same. In mid-September, Massachusetts was recording about 14 daily deaths against a backdrop of 355 daily detected cases 2-3 weeks earlier (assuming a 2-3 week mortality lag). This equates to a CFR of 3.9%. These data should be interpreted in the context of the daily testing rate of 638 per 100,000 people, keeping in mind that as the testing rate goes up, we catch more cases, and so the CFR should go down. In New York state on the same dates, the CFR was 1.3%, despite a testing rate of 443 tests per 100,000. That is, even though the testing rate was almost 1.5 times higher in Massachusetts than New York, the CFR in Massachusetts was 3 times greater. In Connecticut, the CFR was 1.3%, and the testing rate was 438 per 100,000: again, MA was reporting a death rate 3x higher despite a testing rate 1.5x greater. It seems implausible that Massachusetts, with some of the best hospitals in the world, was delivering significantly poorer clinical care than these other states. Therefore, either NY and CT were undercounting their COVID deaths (perhaps not testing enough), or Massachusetts was over-counting them (perhaps ascribing COVID as the cause of death in individuals who had multiple acute or chronic health problems at the time of their passing, of which COVID was not the most problematic). How can we determine which was true?

A reliable way to assess the accuracy of the recorded death toll is to look at excess mortality from all causes, by comparing deaths in 2020 to deaths in recent years. The CDC provide these data in week-by-week plots. Excess deaths tell us indirectly about the number of deaths attributable to this extraordinary disease by allowing us to factor out the number of deaths we should expect from other “ordinary” causes ? a number which is seasonal, increasing reliably every Fall. The plot below shows weekly deaths in Massachusetts, from 2017 to 2020, with the orange line representing the threshold for excess deaths (relative to the same week in years 2013 – 2019, see technical notes here). The devastating impact of the first COVID wave in MA is evident in the 11 weeks marked with a red cross (+ means deaths exceeded the threshold). But since early June, only a single week in October reported excess deaths, with a total of 4 deaths above the excess death threshold (the plot includes data reported up to the week ending Nov 21).

The same plots for New York and Connecticut (find them here by selecting the relevant jurisdiction) show a similarly devastating Spring wave, followed by a very modest second wave, but one that does include some excess deaths in recent weeks (although in NY this “second wave” resembles the 2018 seasonal flu in terms of excess mortality). The overall picture ? with CFR higher in MA than in NY and CT, but excess deaths lower ? suggests that, rather than NY and CT under-counting deaths to produce a falsely low CFR, Massachusetts may be over-attributing deaths to COVID, resulting in an over-estimated CFR. In line with this, the cumulative number of COVID deaths had reached ~10,600 in Massachusetts by the end of November, but this number does not square with the cumulative excess mortality in MA from February to the end of November, which stands at around 7,500 (calculated from data here).

To be clear, I am far from suggesting fraud or scientific malpractice in the counting of deaths in Massachusetts. The attributing of deaths to COVID is tricky. The discrepancy of around 3,000 deaths (between excess mortality and COVID mortality) can perhaps be explained by the fact that the average age of COVID deaths is 81 years in Massachusetts, with 98% of deaths occurring in individuals with underlying conditions. In other words, many deaths are occurring in frail individuals with multiple co-morbidities, and it must often be impossible to distinguish between people who die of COVID (the virus is unambiguously the cause of death) and people who die with COVID (having had a positive test, but with the cause of death being a complex mixture).

In view of these analyses, it is clear that excess mortality is the best measure of the impact of COVID on society (even though it may even overestimate the true count, if the extraordinary circumstances of 2020 have increased other kinds of deaths, e.g., from dementia, untreated heart disease or unscreened cancer).

At the present time, we have no good measure of the long-term impact of school closures on children’s health and cognitive development, or of the economic ruin delivered by lockdowns on adults’ life expectancy. We know that the impact is likely, at least for some, to be devastating. As measured by excess mortality, the current impact of COVID on the Massachusetts population seems insufficient to justify the complete or even partial closure of elementary schools. It’s time to count the impact of COVID accurately and weigh it more carefully against the impact of our mitigation measures.

Rosie Cowell (rcowell@umass.edu)

Thanks to Carlo Dallapiccola, Dave Huber and Adrian Staub for helpful discussion and comments.

How to measure COVID risk: Lives or life-years?

The implicit aim of government and state policies regarding COVID and the explicit focus of news media coverage of the pandemic is on lost lives. This is understandable. Every life is precious, and every lost life is a tragedy. However, everyone would agree that a life cut short is more tragic than a life well-lived to old age. One measure of the tragedy is in terms of lost life-years; a life cut short is a greater loss of life-years. It is the current focus on lives rather than life-years that leads to policies designed to protect the elderly from COVID more than younger people (e.g., special shopping hours), since the lives of the elderly are more likely to be lost. Paradoxically, however, many young people are unduly fearful of COVID and many older people are somewhat cavalier regarding COVID. But maybe both attitudes are rational when considering the potential risk of lost life-years rather than lost lives.

A remarkable feature of COVID deaths is their age dependency, with nearly a 1,000-fold difference between the probability of death from COVID for the elderly as compared to children. In fact, it has been pointed out that the age distribution of COVID deaths is similar to the age distribution of all deaths (see graph below, noting the huge spike for 85+, which is nearly identical for COVID versus death by any other cause). In other words, regardless of one’s age, the probability of dying in the next year is directly proportional to the probability of dying from COVID, once infected. As a direct result of this, the average age of COVID deaths is nearly the same as life expectancy (life expectancy is the mathematical average of all lifespans in the population).

US COVID-19 Reported Deaths by Age 2/1 – 11/28

Roughly speaking, around 1% of people in the U.S. die each year from any cause (i.e., around 3 million). Early in the pandemic, it was believed that the infection fatality rate for COVID was approximately 1% (note that infected is not the same as confirmed COVID cases considering that many infections are never confirmed). Because the infection fatality rate and death by any cause are both 1%, and in light of the age distribution of COVID deaths, this implies that the risk of dying from COVID, if one were infected, is equivalent to the probability that one would die in the next year from any cause. A 20-year old does not expect to die in the next year whereas an 80-year old knows there is a non-negligible chance that their next year might be their last. Putting this differently, one might say that the risk of death from living a normal year of life is about the same, for any given age group, as the risk of dying from a COVID infection.

Subsequent work established that the infection fatality rate is lower than 1%, and is approximately .5% in the United States (i.e. 5 deaths for every 1,000 persons infected). This number is heavily dependent on the age distribution in the population, with values ranging from .1% (Kenya) to 1% (Japan) across different countries (CDC report release November 24, 2020). So, if 1% of the population dies from any cause each year in the U.S., and if .5% of infected individuals die from COVID in the U.S., this implies that the risk of dying from COVID, if infected, is approximately equivalent to the risk of dying from living for 6 months, regardless of one’s age.

This life-years perspective on COVID risk can be used to determine which COVID mitigation strategies are sensible, weighing the costs against the benefits, and which are too extreme. For instance, an extreme form of lock-down in which no one was allowed to leave their home (i.e., shelter in place) for an entire year might be sensible to protect society from the bubonic plague, given its 50% infection fatality rate. However, such a policy would not be sensible for COVID – it would not make sense for everyone to suffer through 12 months of utter misery simply to save themselves from 6 months worth of life-risk from COVID. During 12 months of shelter in place, the probability that one would die from something other than COVID would be greater than the probability of dying from COVID, if infected.

If society is not in extreme lock-down, this ‘6-month benchmark’ can be applied to guide recommended activities. Wearing a mask does not entail much misery and it doesn’t have any lasting negative consequences. The same is true for avoiding hugs with people outside your home. But how about losing one’s job? By how much does that shorten one’s life expectancy? If it does so by more than 6 months, then it is better to risk COVID than to lose your job. How about missed education, which is known to shorten life expectancy? Gaining weight because of lack of access to a gym? Letting a small business collapse? Many of the COVID restrictions could result in the loss of personal endowments (e.g., weight gain, education loss) and the loss of brick-and-mortar institutions (e.g., businesses, universities, libraries, athletics clubs) that will cause the loss of more than 6 months’ worth of life expectancy for many of the people affected, or, if not lost life expectancy, then a severe reduction in the quality of life for a time period substantially greater than 6 months.

This life-years risk assessment highlights why there is an urgent need for government relief. Only with payroll relief and other grants (e.g., to help schools reopen) can we keep people employed, keep children in school, and keep our businesses and institutions in existence. This relief can help keep the life-years cost of COVID mitigation measures under the 6-month threshold.

David Huber (dehuber@umass.edu)

Constructive comments welcome. Thanks to Rosie Cowell, Carlo Dallapiccola, and Adrian Staub for very helpful discussion.

So many new cases in Massachusetts, but relatively few deaths. Why?

For a first post on this blog, I’ll address a question of immediate local concern:  How worried should we be about the local and statewide increase in Covid-19 cases that we’ve seen in the last couple of months?  Are we heading back to the levels of hospitalizations and deaths that we saw in the spring?  A number of local sources have been sounding the alarm in the last few weeks, including here and here.  To anticipate the take-home message:  No, we are not heading back to springtime levels of hospitalization and death, because what predicts hospitalizations and deaths is not the number of cases, but the number of cases among older people…and we don’t have very many in Massachusetts.

Let’s start by looking at some data.  Below are the Massachusetts data from today’s (12/2/2020) New York Times Covid-19 dashboard.

On the upper left, we see the striking increase in the number of documented Covid-19 cases in Massachusetts in the last two months or so.  But the two graphs on the right indicate that there has been only a very slight increase in the number of Covid-19 deaths, and only a slightly steeper rise in the number of hospitalizations.  While the number of daily cases in recent weeks has actually exceeded the number during the ‘first wave’ in the spring, deaths and hospitalizations are a small fraction of their numbers in the spring.  

The dissociation between cases and deaths is even more striking when we zoom in on Hampshire County.  The New York Times now presents county-level data; a screenshot from today is below.

In Hampshire County, there has been a ‘wave’ of cases this fall, like at the state level, but simply no detectable increase in deaths.  (The Times does not provide county-level hospitalization data.) 

What should we make of this dissociation, whereby cases have increased dramatically, but deaths only slightly, or not at all?  Two simple positions could be labeled ‘alarmist’ and ‘denialist’.  The alarmist position would hold that the deaths are coming; an increase in Covid-related deaths will take a few weeks to appear after an increase in reported cases.  But a delay of a few weeks would not be enough to account for this pattern, as cases began their steep rise in October, at both the state and county level.  The denialist position would emphasize that we are identifying more cases only because of expanded testing; we are finding asymptomatic and mild cases that will not lead to hospitalization or death, which we would not have identified in the spring, when testing was quite restricted.  But this can’t account for all of the increase in cases; the left two panels of the first figure show that while the number of daily tests has gone up by perhaps 50% since early October, the number of cases has gone up by perhaps 300%. 

So, neither the alarmist explanation (the deaths are coming, just wait) nor the denialist position (there’s no real increase in cases, only an increase in testing) can fully explain why we have seen such a steep rise in cases, but without much (or any, in Hampshire County) rise in deaths.  This blog is called Covid Balance, after all!  Fortunately, this puzzle has a clear solution, though it does not seem to have been much discussed in the media.

Below are two sets of graphs from the Massachusetts Department of Public Health.  The left panel of the first figure shows the age distribution for cases reported as of May 29.  The left panel of the second figure shows the age distribution for cases reported in the midst of the ‘second wave,’ in the two weeks prior to November 27. 

We see a rather remarkable shift.  In the first wave in the spring, the average age of individuals diagnosed with Covid-19 was 52, while in November, the average age was 39.  But much more important is what is going on at the right edge of the age distribution.  In the spring, 14.6% (13882/95271) of all individuals who were diagnosed with Covid-19 were over 80 years old, and 23.6% were over 70.  In the two-week period in November, only 3.2% (1149/36194) were over 80 years old, and 7.6% were over 70.  It is difficult to overstate the importance of this shift:  In the Spring, almost 1 out of 7 Covid-19 cases occurred in people over the age of 80, and almost 1 out of 4 over age 70; in November, it was about 1 out of 31 over age 80, and 1 out of 13 over age 70.  

Below are two more figures from the Massachusetts DPH, this time showing the age distribution of Covid-19 deaths in the pre-May 29 period, and in the two weeks prior to November 27.  

We see that in both time periods, the majority of individuals who died from Covid-19 were in the 80+ age group.  In fact, the percentages of deaths that were among individuals in the 80+ group are remarkably similar:  62.6% in the first period, and 62.7% in the second.  People over 70 accounted for 84.9% of all deaths in the first period, and 82.6% in the second.  The average age of death was 82 in the first period, and 81 in the second.  

How can older adults account for a similar majority of deaths in November and in the spring, while accounting for a much smaller proportion of cases in November?  The answer is simple.  The risk of hospitalization or death from Covid-19 is so much greater for the elderly that most deaths will be among older people even when the vast majority of cases are among younger people.  Below is a graphic from the CDC that illustrates just how extreme are the age-related changes in Covid-19 hospitalization and death rates.

The risk of death from Covid-19 is, according to the CDC, 630 times higher in a person over the age of 85 as in a person in the 18-29 year-old comparison group.  This difference in mortality risk is so extreme that the number of cases in younger people is almost irrelevant to the overall number of deaths.  If you want to know how many deaths from Covid-19 will occur in a particular area, don’t ask how many cases there are; ask how many cases there are among elderly people.  

The simple answer to the question of why there has been little increase in deaths and hospitalizations in Massachusetts during this second wave of cases is that this wave is occurring mostly among younger people.  It is certainly an interesting question why this is so, and there are probably multiple contributing factors.  One factor might be increased awareness of what I’ve highlighted here, i.e., how the severity of Covid-19 depends on age.  This has probably made many older people quite cautious, while at the same time it has allowed younger people to take some risks, as they are aware that getting Covid-19 is not likely to result in serious health consequences, for them personally.

The impressive rise in cases, in Massachusetts and in Hampshire County more specifically, does not indicate that we are heading back toward springtime levels of death and hospitalization.  To the contrary, with the current age distribution of cases, where only 3.2% of cases are in people over the age of 80, it would be essentially impossible for the state of Massachusetts to return to the levels of hospitalization and death that we saw in the spring.  The age distribution could change, of course, but at present we should be reassured that we are keeping the health impact of Covid-19 low, in relative terms, by doing a fairly good job at preventing the most vulnerable among us from getting it. 

Adrian Staub (astaub@umass.edu).

Constructive comments welcome. Thanks to Rosie Cowell, Carlo Dallapiccola, and Dave Huber for very helpful discussion.