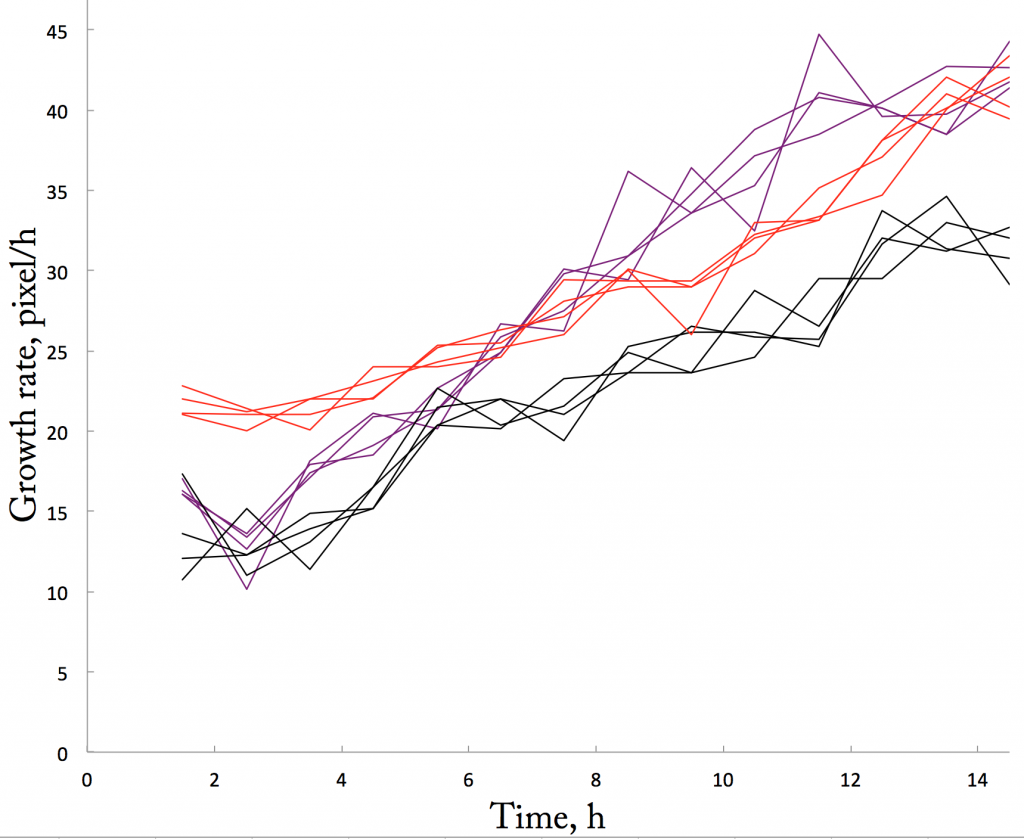
The third repetition is in, with notable implications for averaging and my measurement chops. To be specific, I have repeated for the third time the system where seedlings are transplanted onto an experimental plate by poking the roots into the agar medium. Poking into the agar sounds a bit extreme but I wrote earlier about what has compelled me to do so (Feb 18th). In general, rep. number 3 looks … repetitive (Fig. 1). If you have been following this thread, you will have seen a lot curves that look more or less like this. If you haven’t but would like to, then please start with the Oct 15th post and have a binge read.

Repetition is good. Having now done three experiments with roots in agar, I can say that in general roots grow similarly whether I put them inside or on top of the agar (or on top of moist paper). Good to know that inserting roots in agar does not cause some disaster. While it would have been a treat if they grew at a steady rate inside the agar, instead of accelerating slowly but steadily, I can think of no reason for that to happen. I am happy for reproducibility.
Still, looking carefully at figure 1, I noticed something. Three of the roots (black, purple, and red lines) grew notably more slowly at the second time point than the first. Strange. If sticking a root into the agar damaged it, then I would expect to grow slow from the start. But no, these three roots slowed down after getting off to a good start. Curious.
I wondered, is this a feature of poking into agar? In the other two agar experiments (last week and the week before), one out of six roots slowed down after the first time point. OK, so it happens, but only sometime. I wondered further, what about the experiments where roots were placed on top of the substrate (whether agar or moist paper)? For those experiments (there are nine), I didn’t plot data for each root, just the average. So, I did that, and saw, for these experiments too, one or two roots grew notably slower after the first time point and then grew faster. This behavior was buried by the averaging.
Well. That implies that the phenomenon has nothing to do with agar. But a curious phenomenon all the same. I wondered further, maybe it is measurement error. Hitherto, I haven’t be too careful about measurement because I don’t really care about the absolute value of the growth and I was interested in assessing the overall behavior of the system.
To look at measurement error, I measured the three down-going roots in figure 1 (red, black, and purple) three more times, each (Fig. 2). In general, the reproducibility is about what I expected. But the first few points of the curves are interesting. For the red and purple root, the original measurement had the most extreme slowdown, compared to the repeated measurements. And the black root had quite the divergence, with some trials having the growth rate go up at the second time point.

Well, I feel confident that the original measurements happen to overstate the initial decline in growth rate for those three roots. I also found a source of error that applies to the initial part of the curves. I have been measuring root growth rate by using a program called image J. I place my cursor over the position of the root tip, and click. This writes the x, y coordinates of the point into the results file and brings up the next frame (the next time) in the image sequence. I move to the new position of the root tip, click, and repeat to the end of the sequence. From the list of x, y coordinates, I calculate the distance between them (using the good and very old Pythagorean theorem) and because the images were captured at exactly one hour intervals, the measured distance over 1 h is the growth rate.
Now, it happens in the image J software that for the first image, the cursor shows up as a cross but after clicking, bringing up the next image, the cursor changes to an arrow. It is more difficult to position the cross-type cursor because it is thick and the arms of the cross obscure the root tip. The arrow is nicer. I had been grimacing about this all along, but nothing more. Well, I found out that there is a preference switch to insist that the cursor is an arrow. Using that from now should generate more consistent data, with respect to the initial point. Note that getting the initial point wrong means that the first rate will be wrong. When the initial rate is too high, then the next one will look like it goes down when really it is accurate. Of course, the opposite probably is happening too – some roots look like their growth rate accelerated right off the mark, and some of these are probably overestimates.
With the cursor-fix, this kind of error will be lessened. I might try measuring at a higher zoom because I think the contrast will bear it. Or measuring all of the roots three times. But the main point is that now I need to look at the kinetics of the inhibitor I want to study. If the effects of this compound are substantial within an hour or two then these uncertain initial kinetics become more important. But if not, then less so. Let’s see…